Understanding GA4 Reports: A Beginner’s Walkthrough
GA4 reports intimidate people for one silly reason: the menu looks nothing like the old Universal Analytics, so even experienced marketers feel lost on day one. But underneath the new layout is a simple, logical structure. Once you see how the reports are organized, you can find any number in seconds. This walkthrough gives you that mental map.
If you’re not yet sure which numbers deserve your attention, pair this with the key website metrics that actually matter — knowing what to look for makes the reports far less overwhelming.
Reports vs Explore: Two Different Tools
The first thing to understand is that GA4 has two separate analysis areas, and people waste hours in the wrong one.
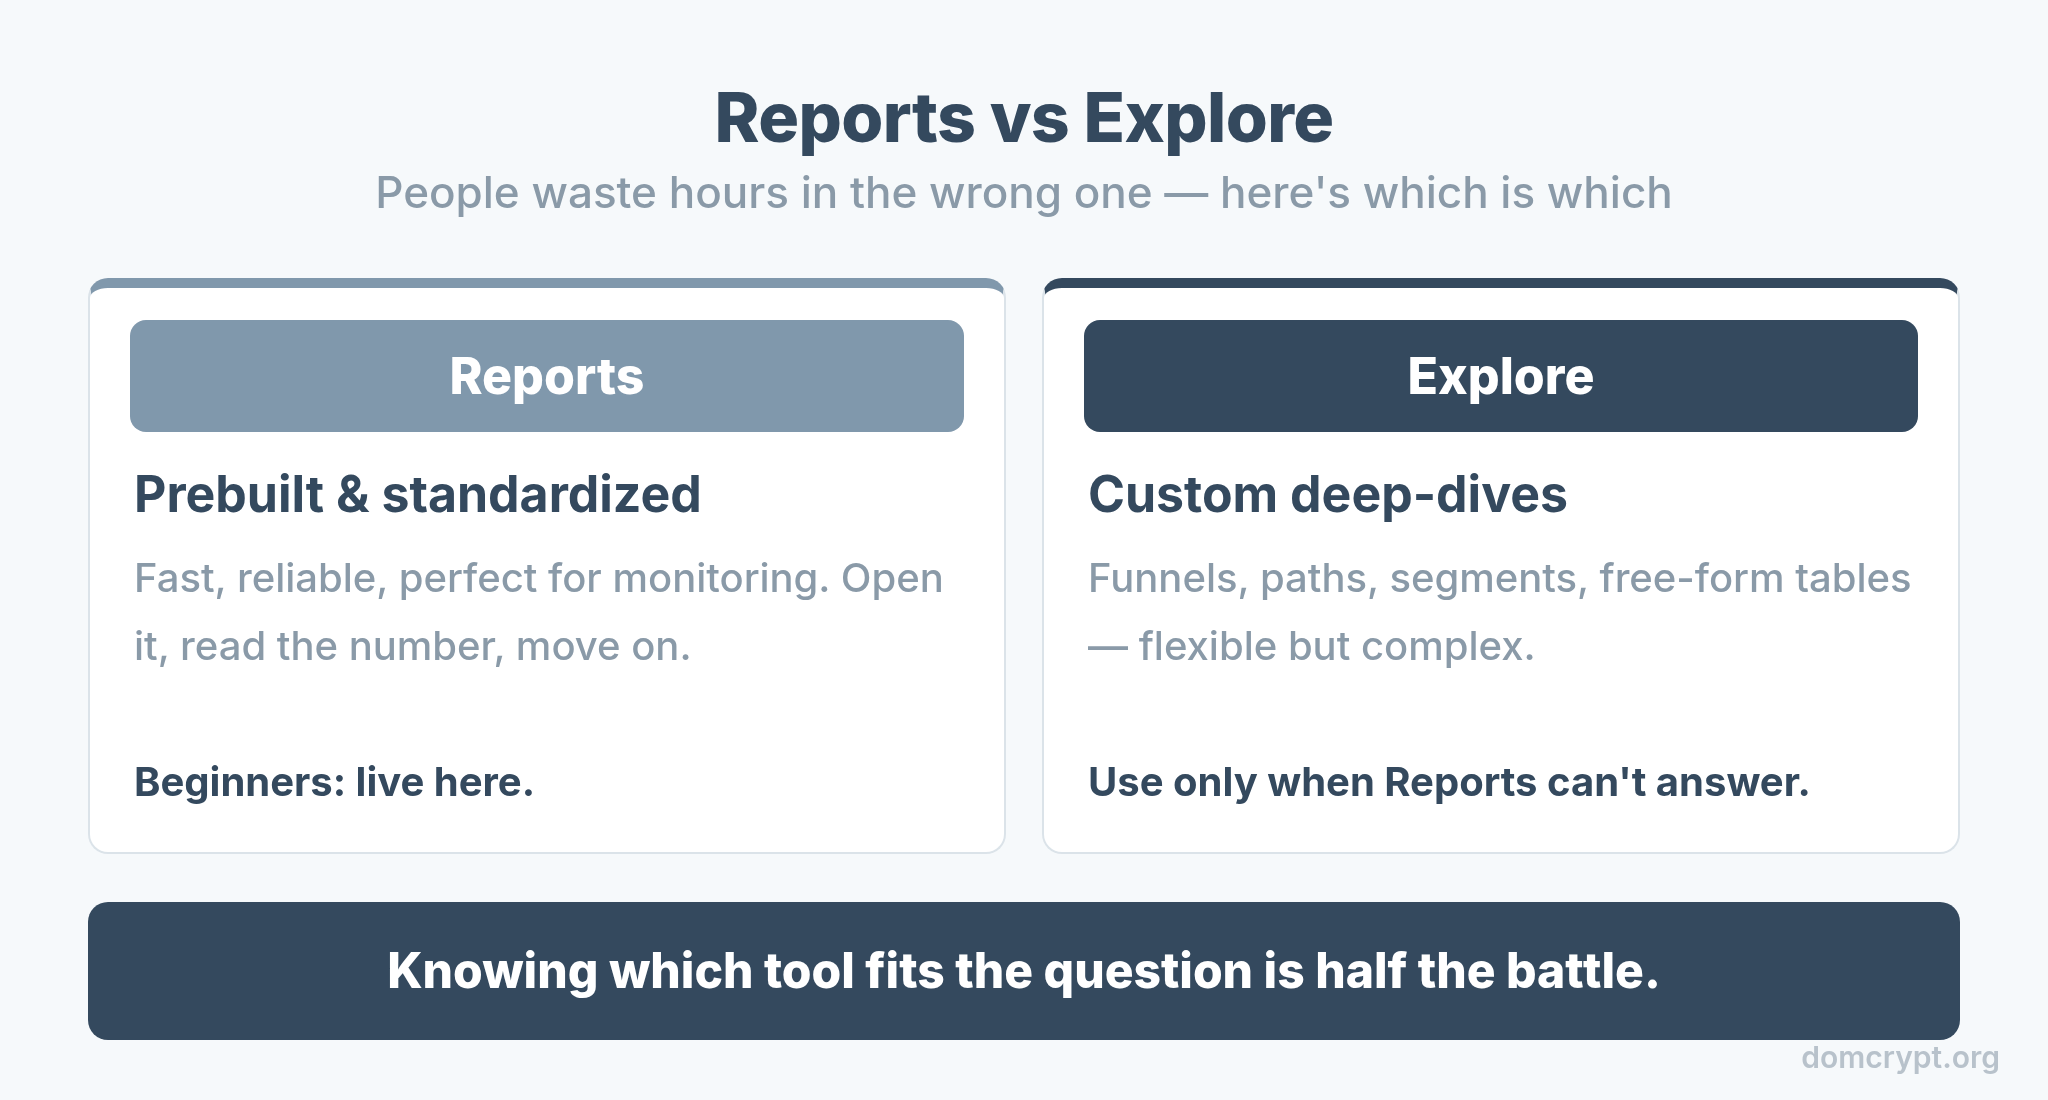
Reports are GA4’s prebuilt, standardized views — fast, reliable, and perfect for monitoring. Explore is a flexible workspace for custom, deep-dive analysis with funnels, paths, and segments. As a beginner, live in Reports. Reach for Explore only when a standard report can’t answer your specific question. Knowing which tool fits the question is half the battle.
The Report Collections
Standard reports are grouped into collections that follow the customer lifecycle. This grouping is the key to navigation.
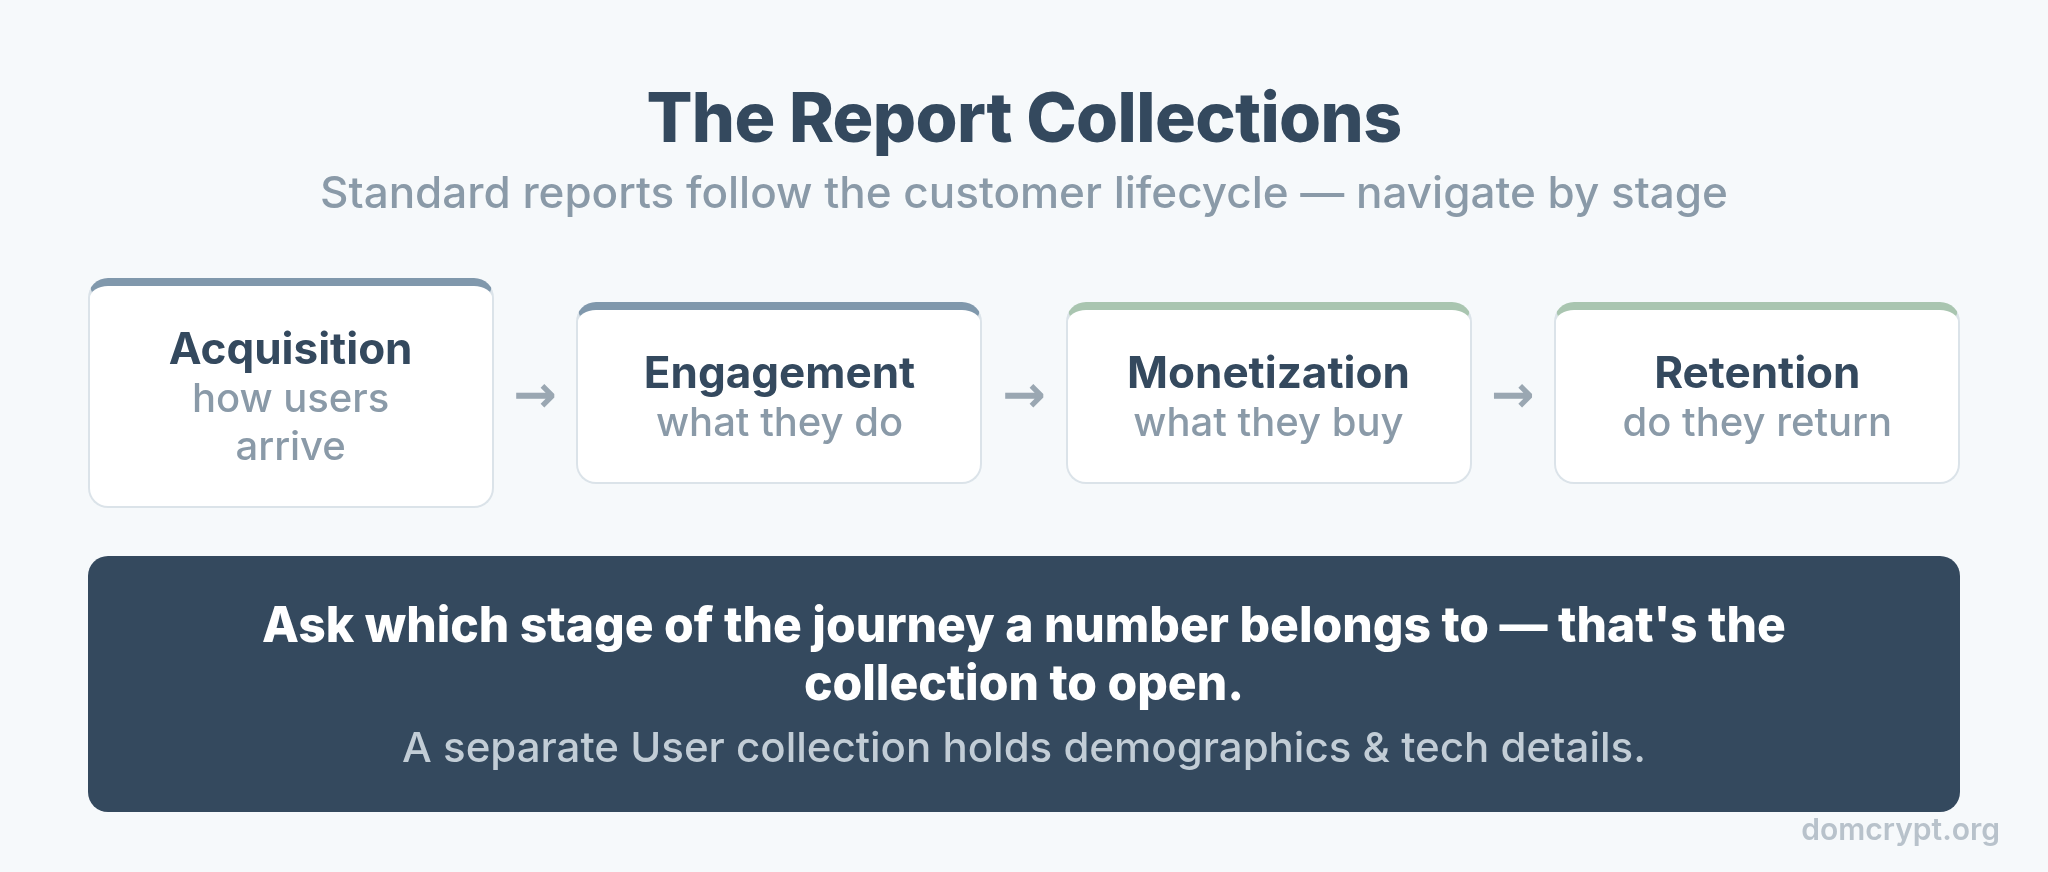
The lifecycle runs in a logical order: Acquisition (how users arrive), Engagement (what they do), Monetization (what they buy), and Retention (whether they return). When you need a number, ask which stage of the journey it belongs to, and you’ll know which collection to open. There’s also a User collection for demographics and tech details.
Start With Realtime
The Realtime report is the one place every beginner should start, because it gives instant feedback that your tracking works at all.
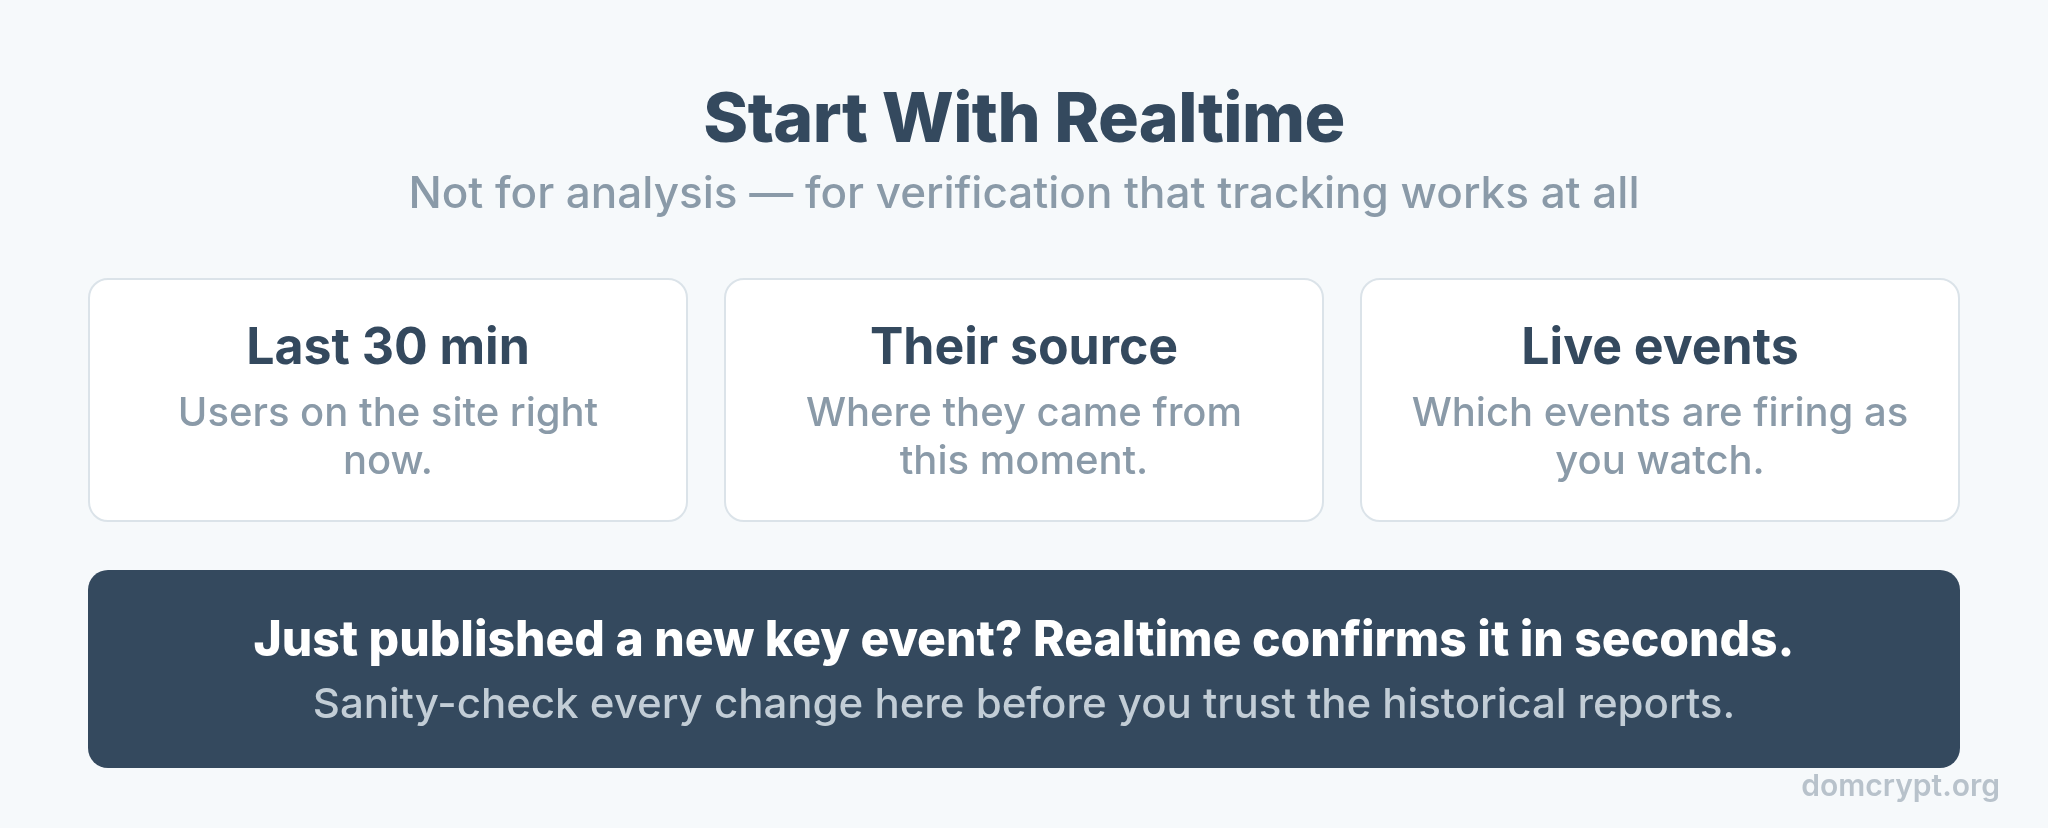
Realtime shows users from the last 30 minutes — where they came from, what pages they’re on, and which events are firing right now. It’s not for analysis; it’s for verification. Just published a new key event? Realtime confirms it in seconds. Use it to sanity-check every change before you trust the historical reports.
Acquisition: Where Users Come From
Acquisition answers the first question every site owner asks: where is my traffic coming from? The trick is knowing the two scopes it reports on.
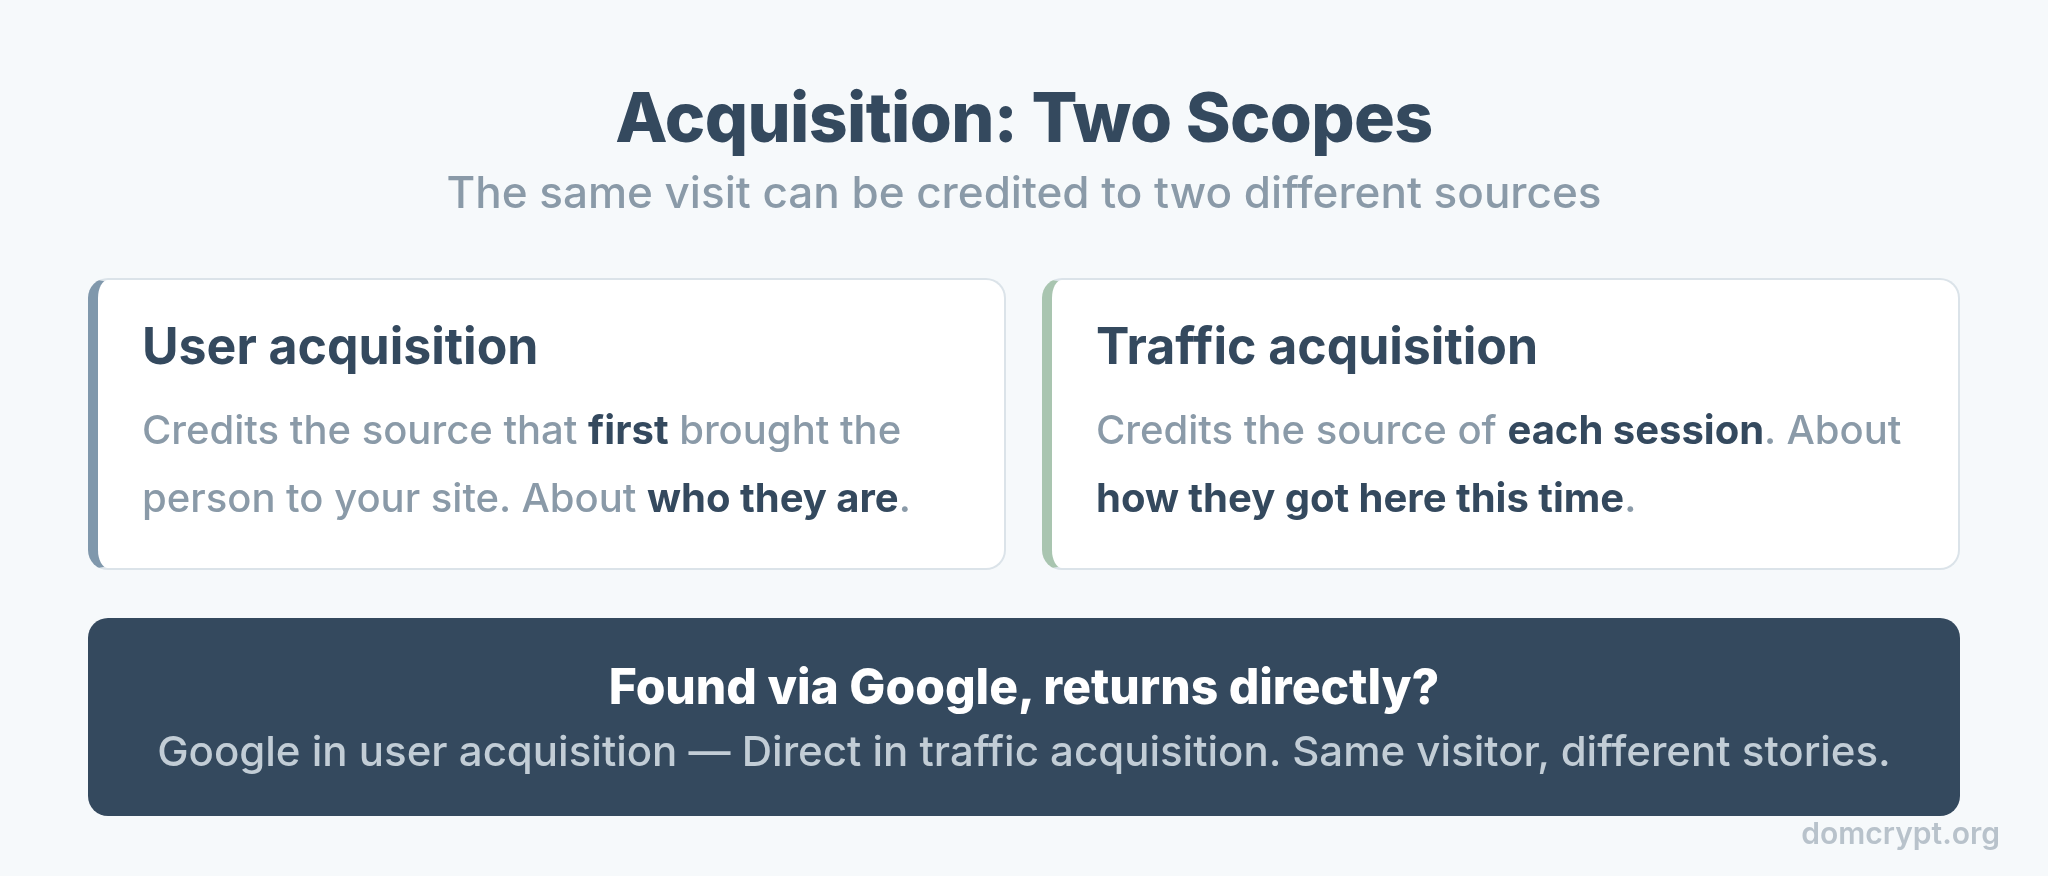
User acquisition credits the source that first brought a person to your site. Traffic acquisition credits the source of each individual session. The difference matters: a visitor found via Google but returning directly counts as Google in user acquisition and Direct in traffic acquisition. This is exactly where attribution models start to matter, because different scopes tell different stories about the same visit.
Engagement: What Users Do
Engagement is where GA4 changed the most from the old days, and where its new logic shines.
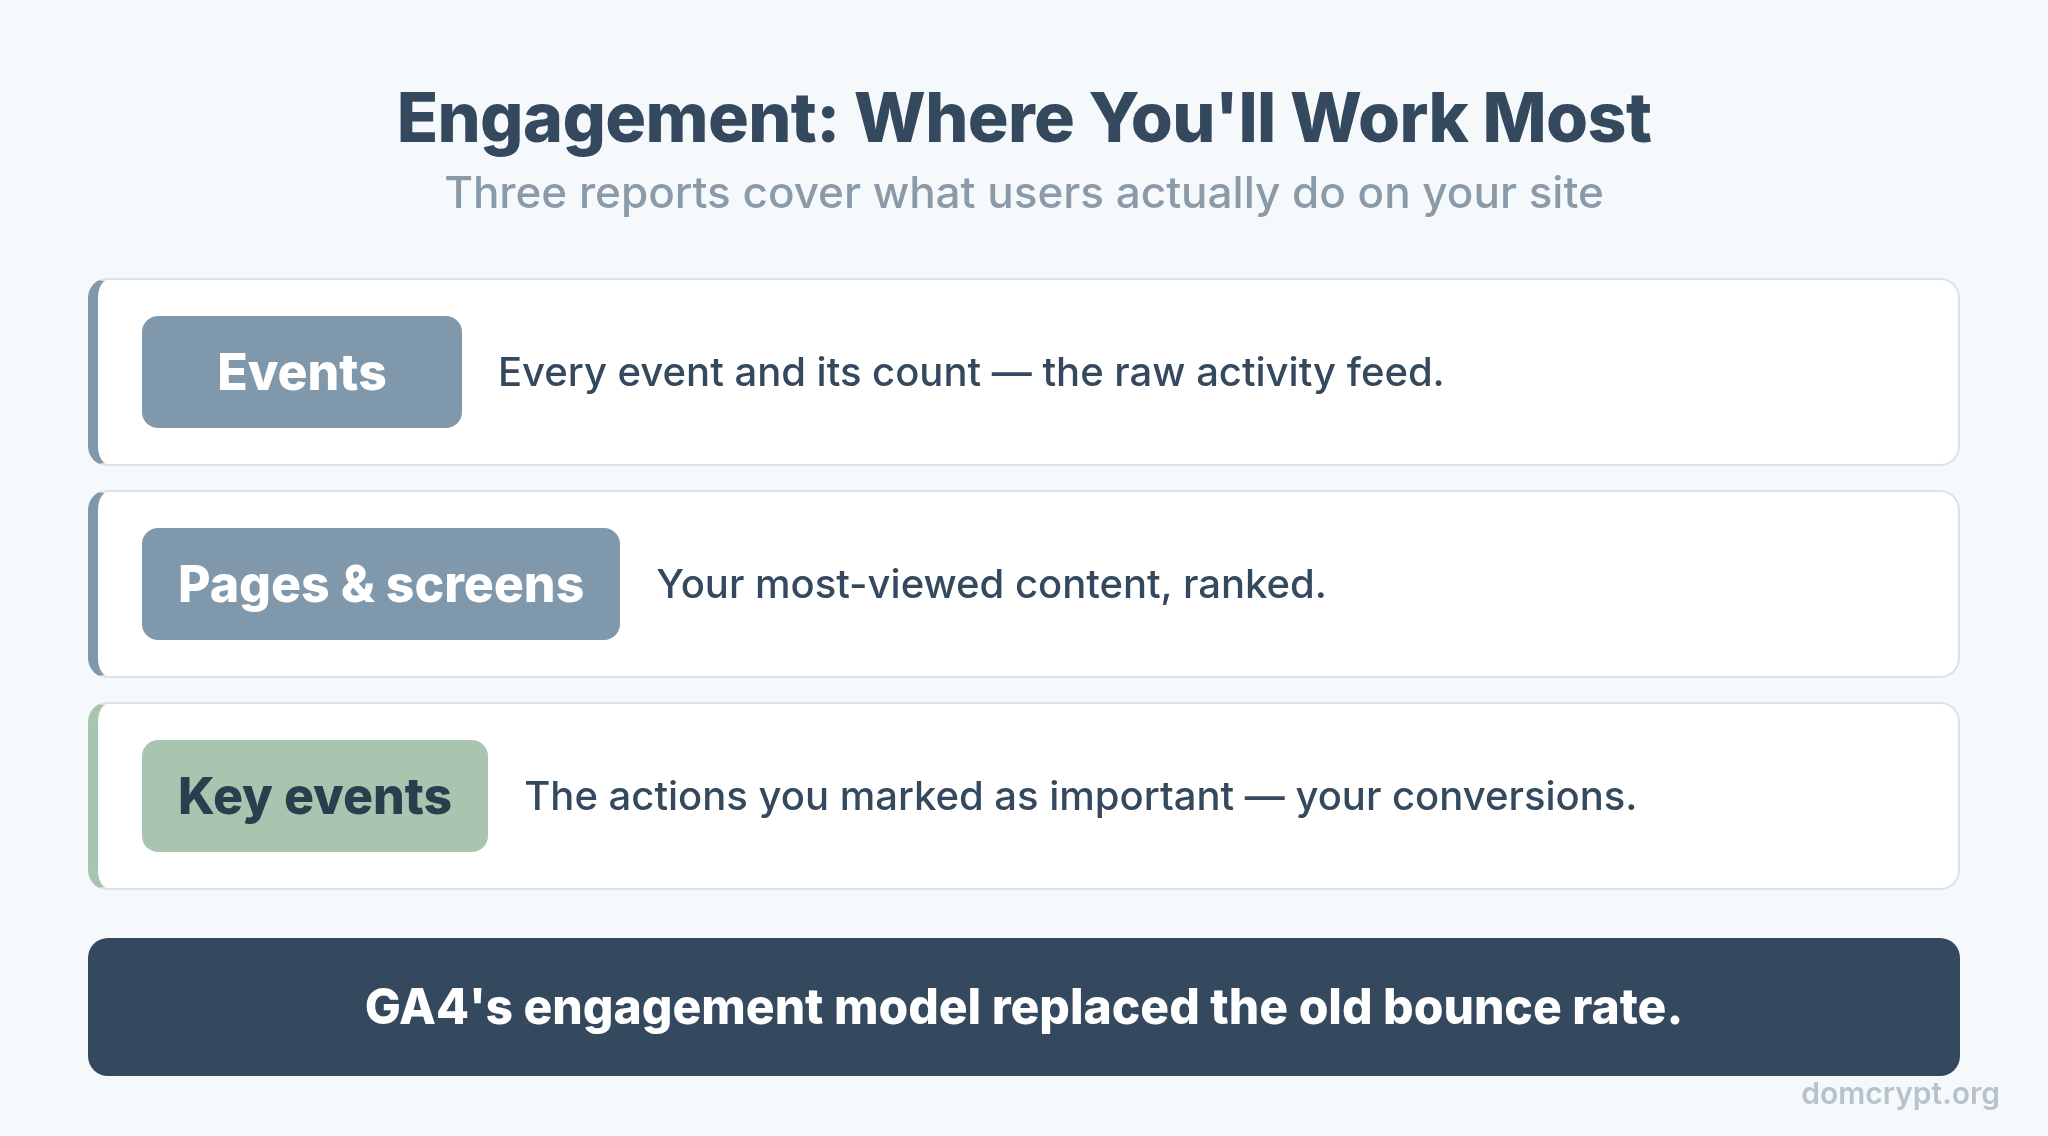
The Engagement collection holds your Events report (every event and its count), Pages and screens (your most-viewed content), and Key events (the actions you marked as important). This is where you’ll spend most of your analysis time. GA4’s engagement-based model replaced the old bounce rate, a shift worth understanding fully in bounce rate vs engagement rate.
How to Read Any Report
Every GA4 report works the same way once you spot the pattern: dimensions describe, metrics measure.
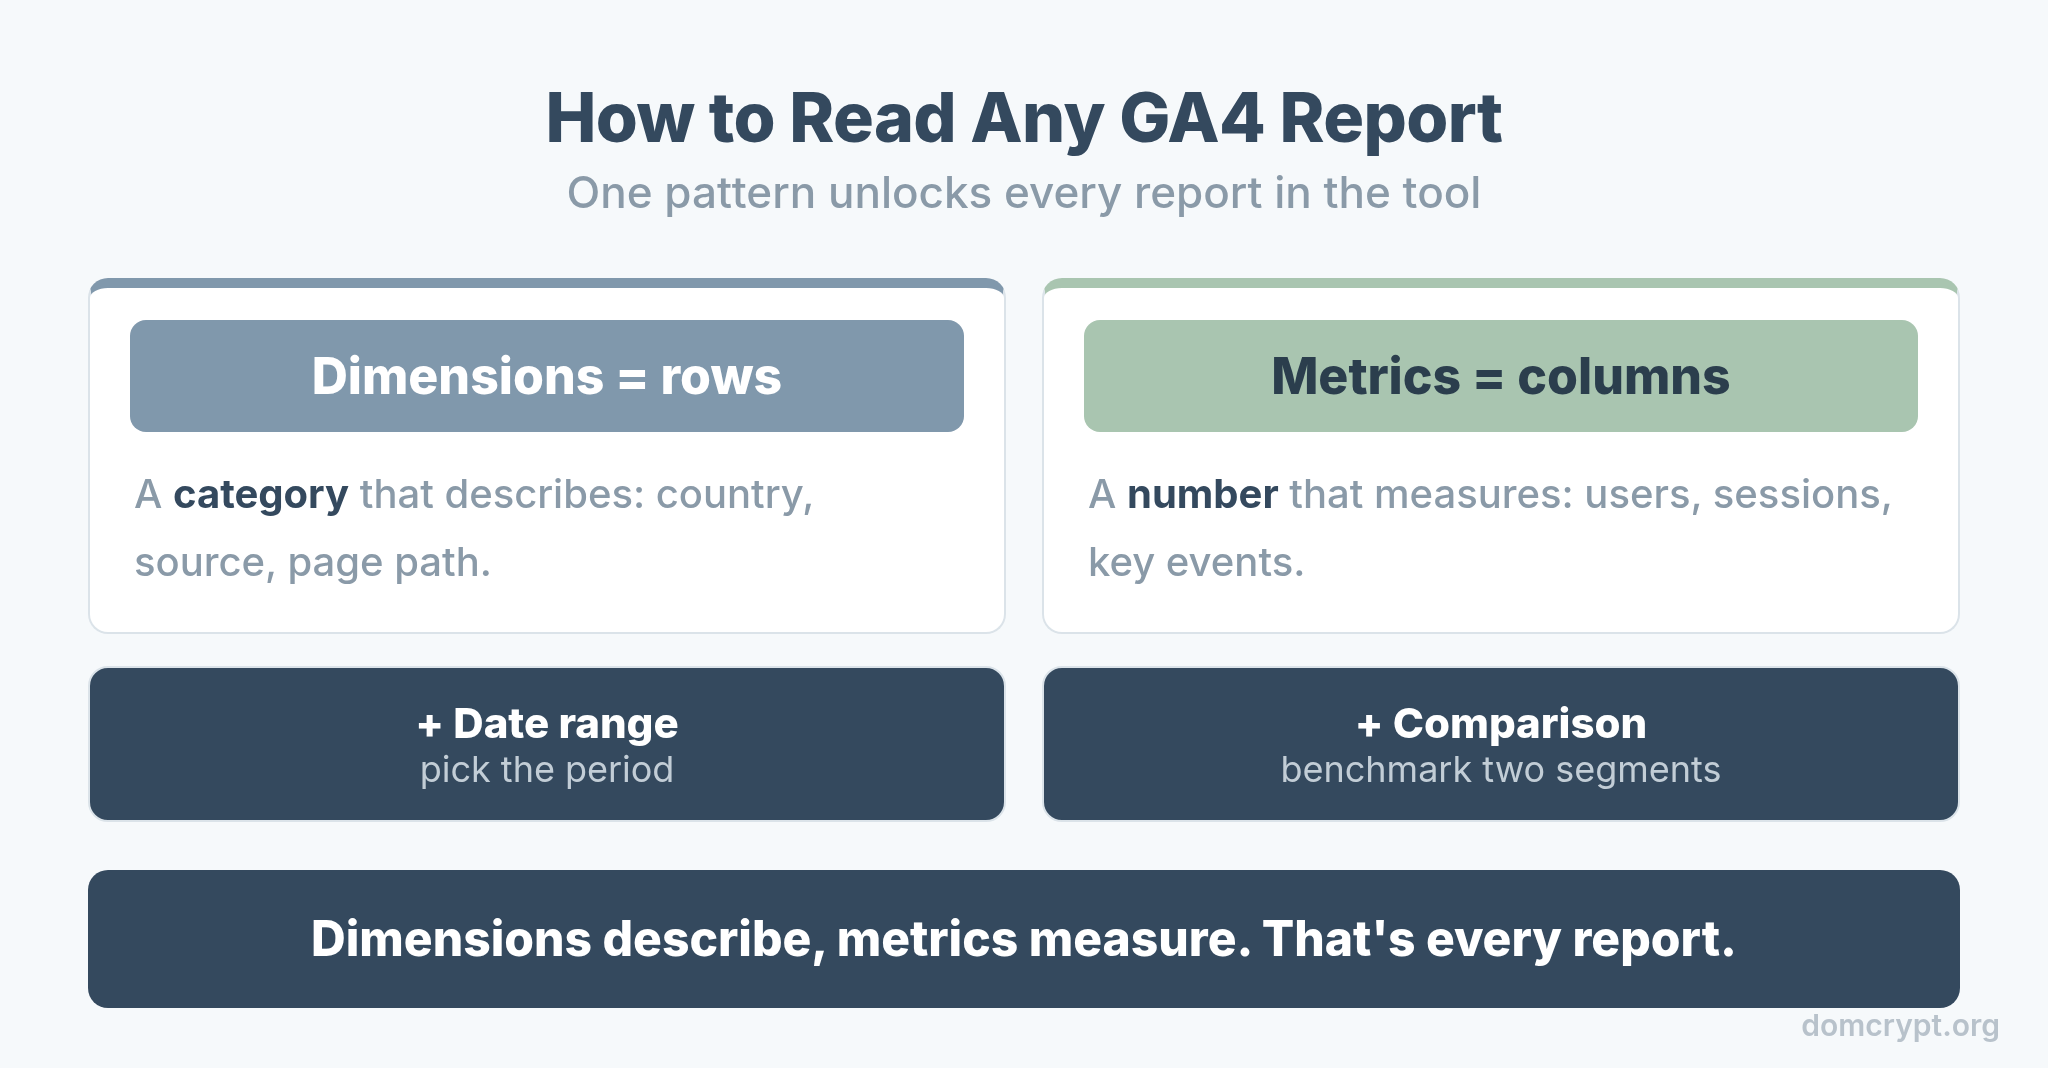
A dimension is a category — country, source, page path. A metric is a number — users, sessions, key events. Reports put dimensions in rows and metrics in columns. Add a date range, apply a comparison to benchmark two segments side by side, and you can answer most questions without ever touching Explore. Master that one pattern and every report in GA4 suddenly reads the same.
The Bottom Line
GA4 reports only feel hard until you see the structure. Stay in Reports for monitoring and save Explore for deep dives. Navigate by the lifecycle collections — Acquisition, Engagement, Monetization, Retention — and start every check in Realtime to confirm your tracking. Remember that acquisition has two scopes, that engagement is where you’ll work most, and that every report is just dimensions describing and metrics measuring. Learn that map once, and you’ll never feel lost in GA4 again.