How to Build a Custom GA4 Dashboard
The default GA4 home screen shows you a pile of numbers nobody asked for, while the three metrics you actually check every morning are buried four clicks deep. A custom dashboard fixes that. The good news: you don’t need Looker Studio or any add-on to build one — GA4 has a built-in customization layer most people never open. This guide shows you how to make GA4 show your numbers first.
Before you build, decide what belongs on the dashboard. A dashboard is only as useful as the key website metrics you choose to put on it — start there, not with the chart types.
Where “Dashboards” Live in GA4
GA4 doesn’t use the word “dashboard” much, which is why people think it can’t do them. It can — in three different places.
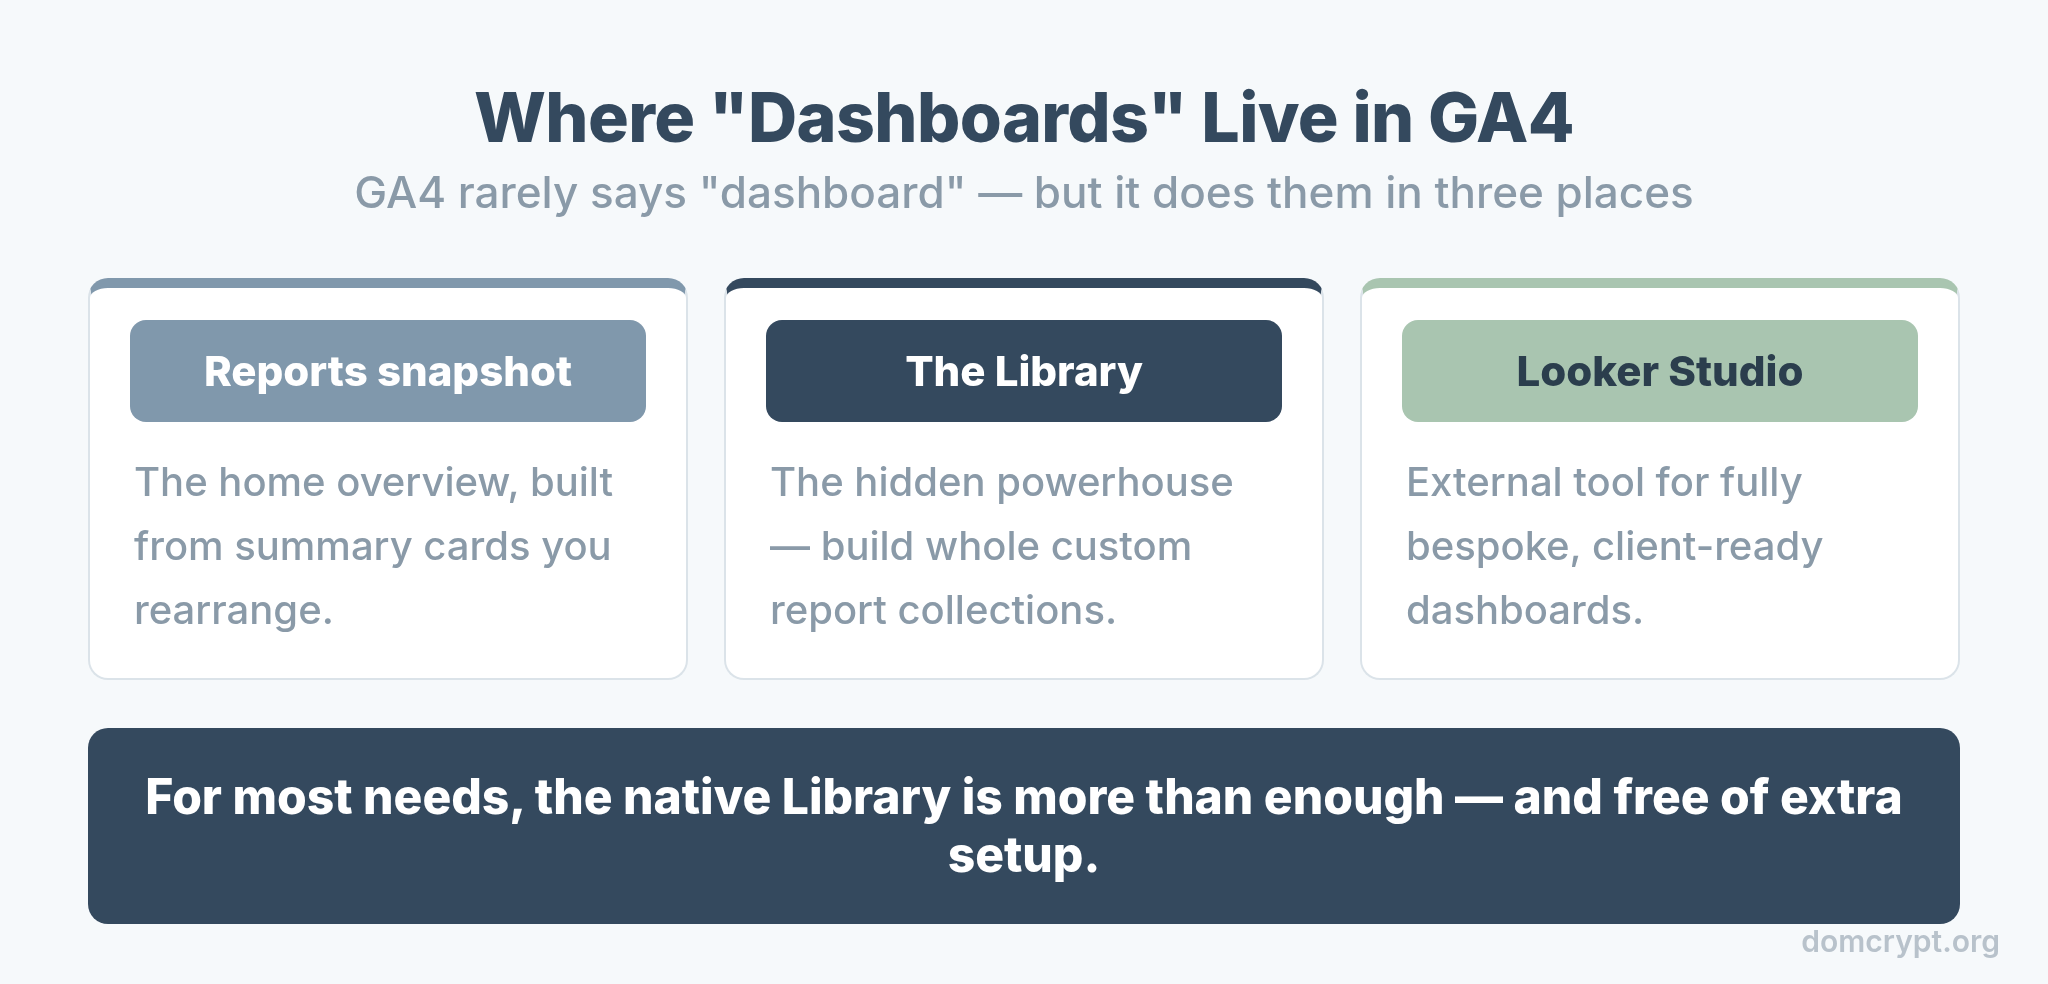
The Reports snapshot is GA4’s home overview, built from summary cards you can rearrange. The Library is the hidden powerhouse where you build entire custom report collections. And Looker Studio is the external tool for fully bespoke dashboards. For most needs, the native Library is more than enough — and it’s free of any extra setup.
The Three Levels of Customization
GA4 customization works in layers. Knowing which layer to use saves you from overcomplicating a simple change.
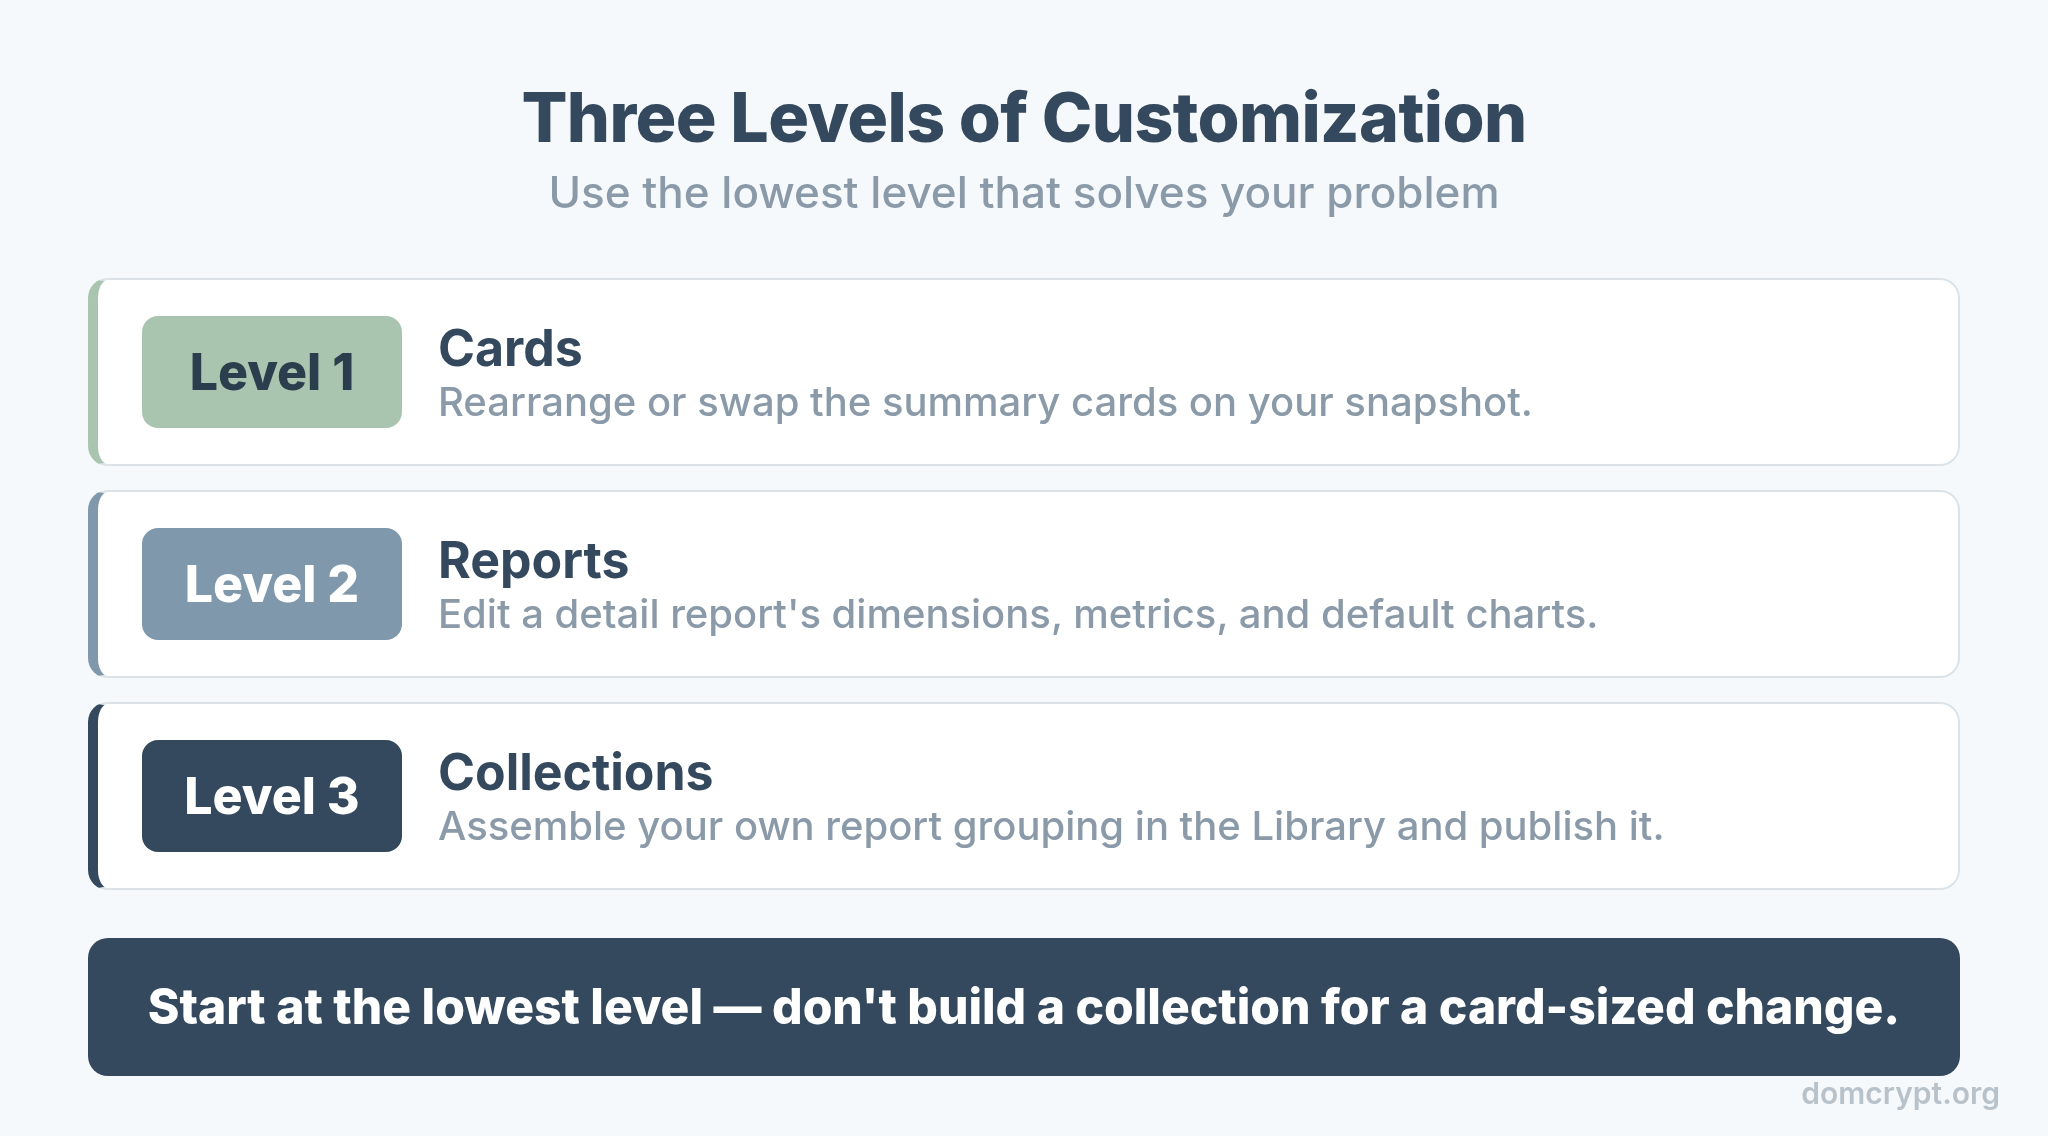
Level 1 — cards: rearrange or swap the summary cards on your snapshot. Level 2 — reports: edit a detail report’s dimensions, metrics, and default charts. Level 3 — collections: assemble your own grouping of reports in the Library and publish it to the left navigation. Start at the lowest level that solves your problem.
What Belongs on a Dashboard
A dashboard crammed with every metric is just a noisier version of the default. Pick a small, role-focused set.
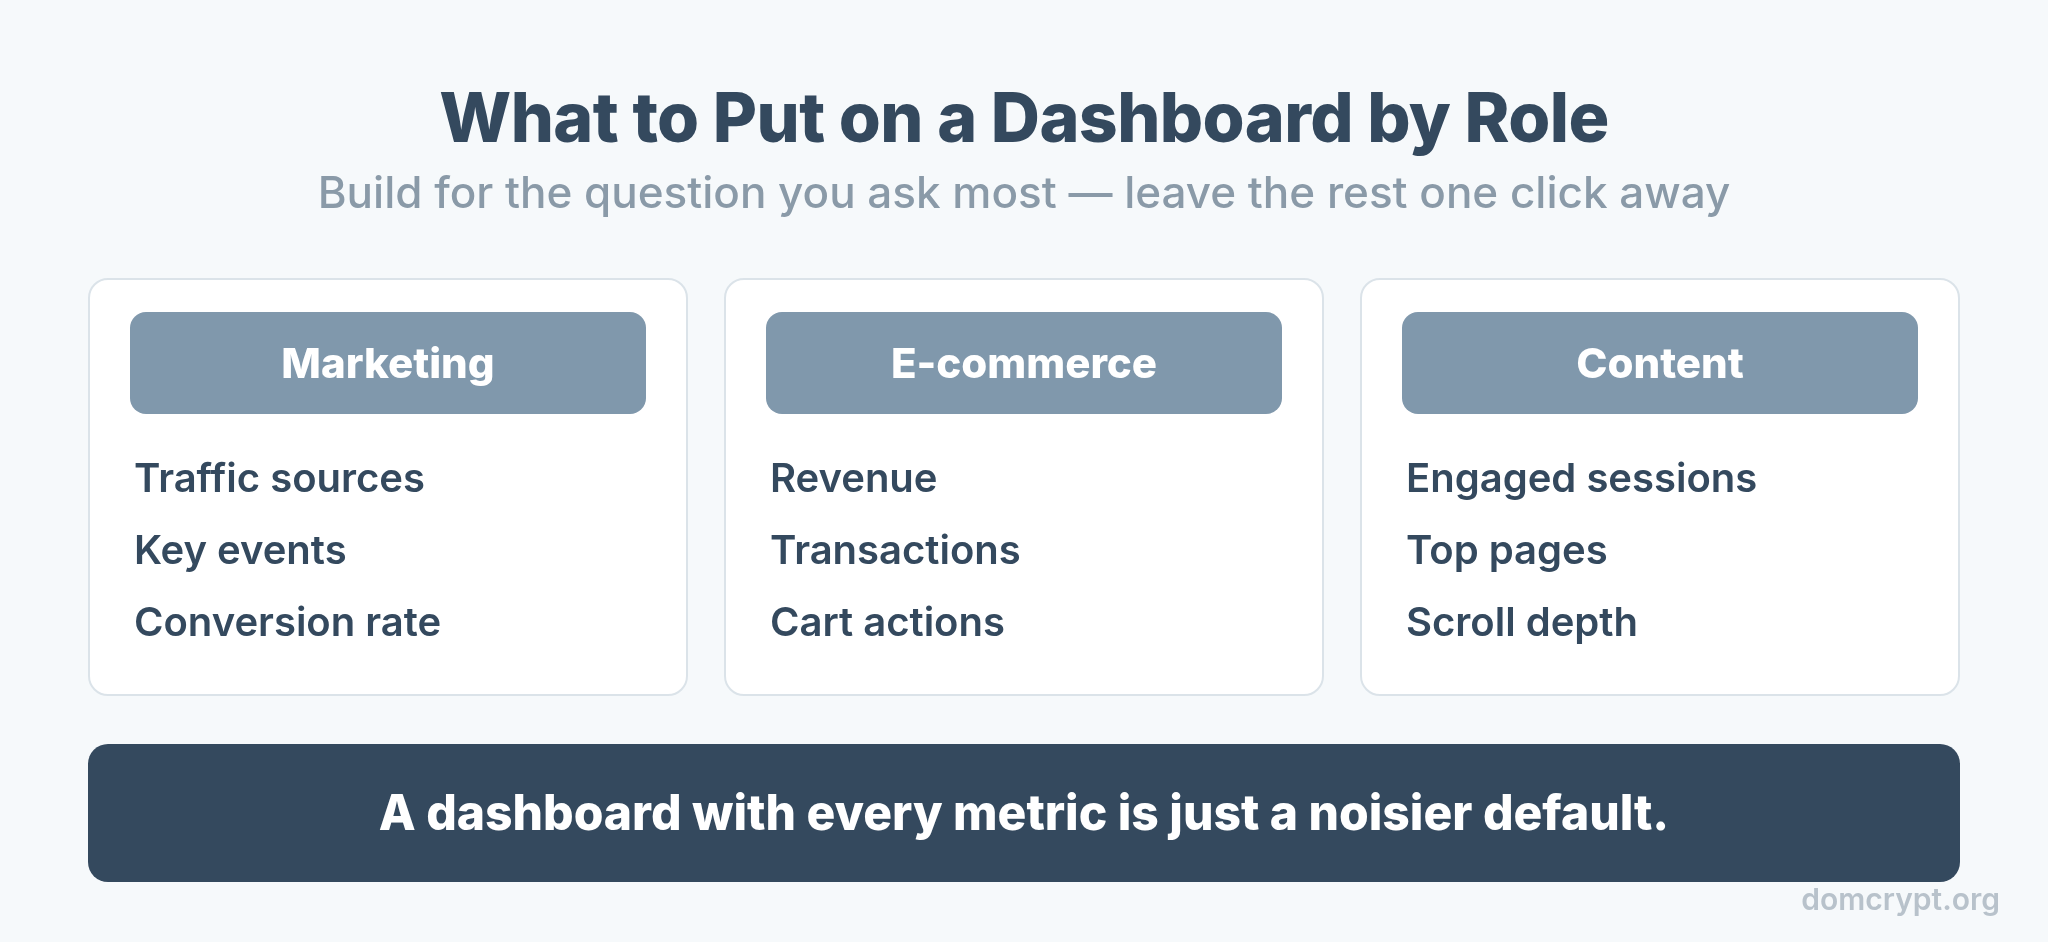
A marketer’s dashboard leads with traffic sources, key events, and conversion rate. An e-commerce dashboard leads with revenue, transactions, and cart actions. A content dashboard leads with engaged sessions, top pages, and scroll depth. Build for the question you ask most often, and leave everything else one click away. The metrics you feature should connect back to your attribution model so you can see not just what happened, but what drove it.
Build a Custom Report Collection: Step by Step
This is the real prize — a custom collection in your left navigation. Here’s the full path.
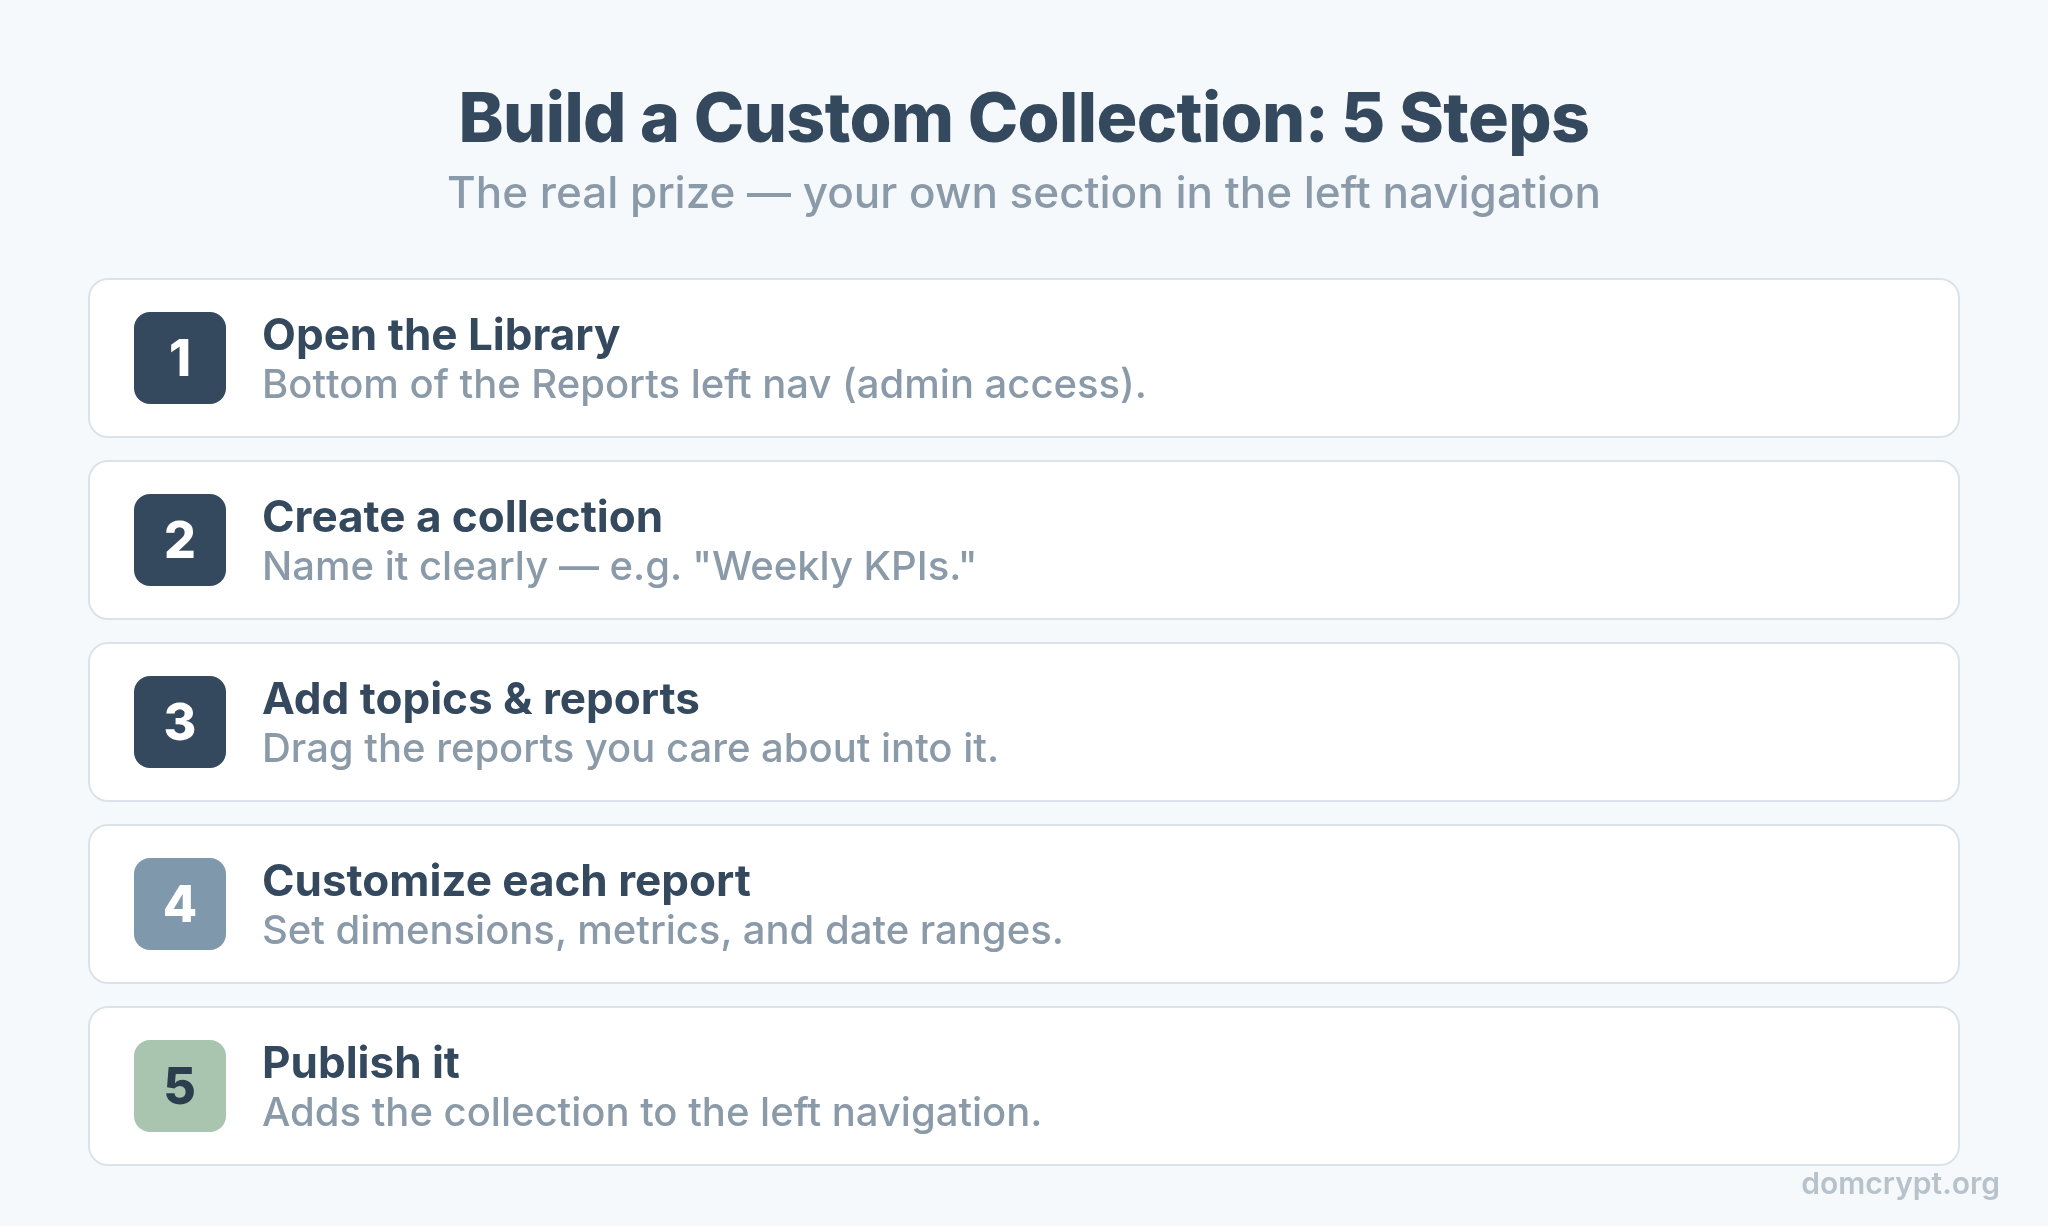
- Open the Library. Find it at the bottom of the Reports left navigation (admin access required).
- Create a collection. Start a new collection and give it a clear name like “Weekly KPIs.”
- Add topics and reports. Drag the detail and overview reports you care about into the collection.
- Customize each report. Set the dimensions, metrics, and date ranges that matter to you.
- Publish it. Publishing adds the collection to your left navigation for everyone on the property.
Customize the Snapshot Cards
If a full collection is overkill, just fix the home screen. The snapshot is built from cards you control.
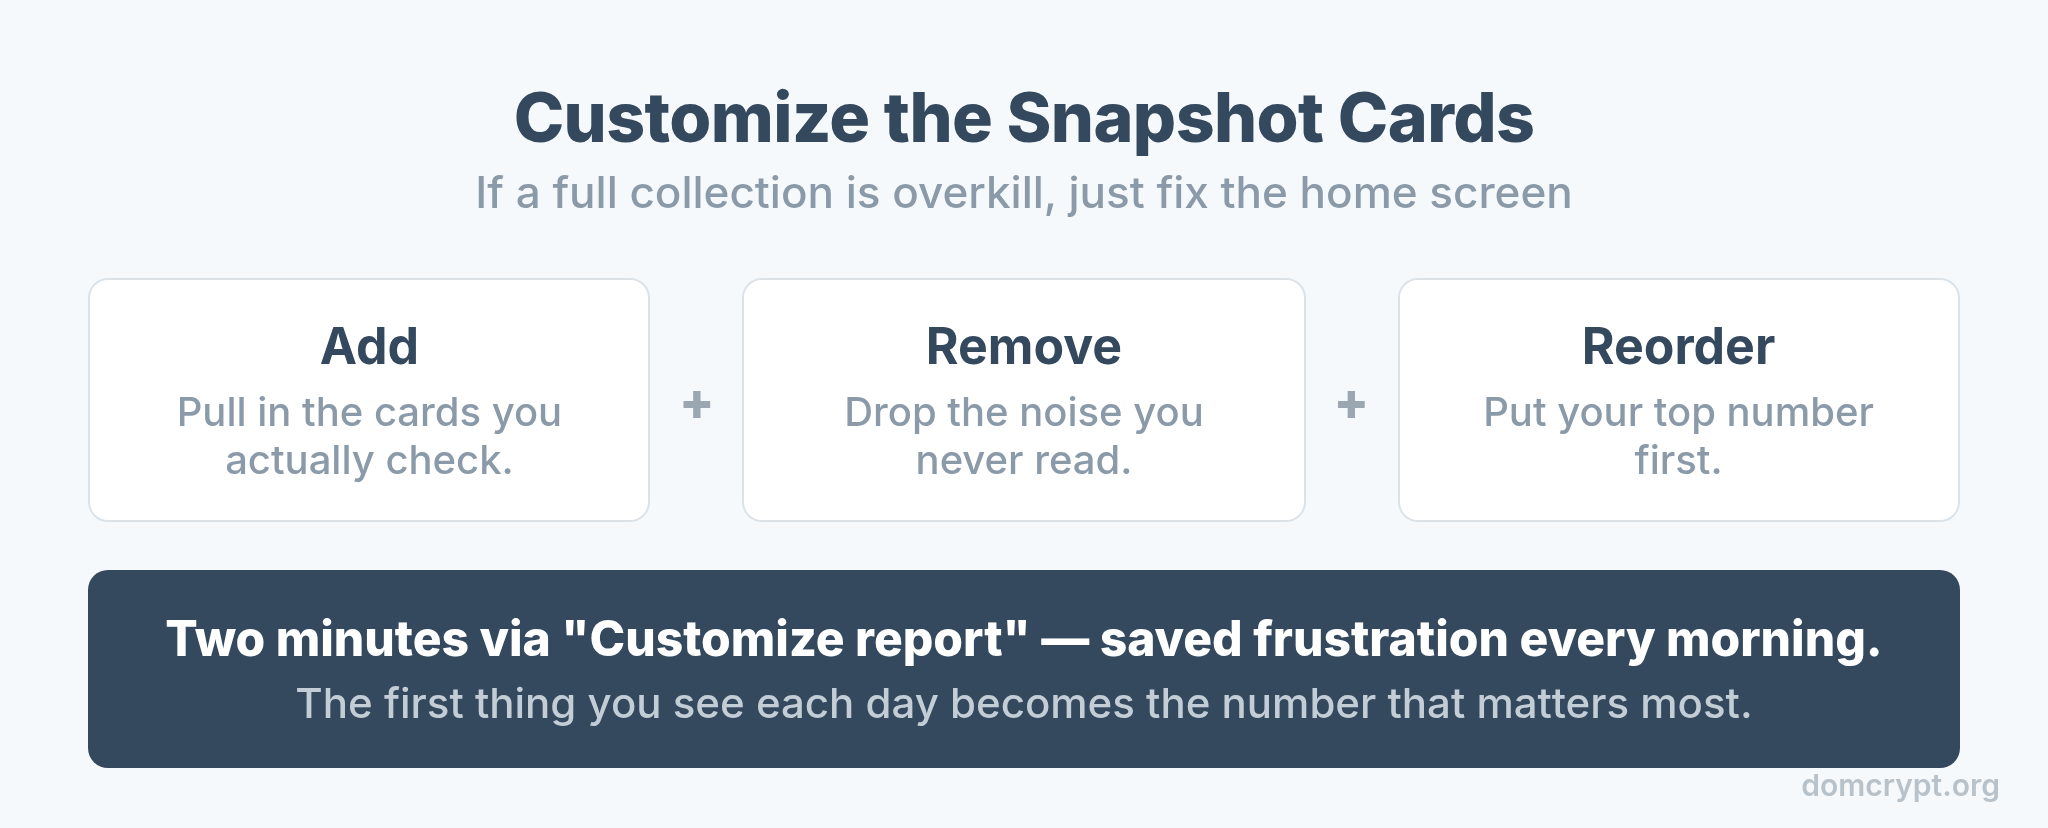
Click “Customize report” on the snapshot, then add, remove, and reorder cards until the first thing you see each morning is the number you care about most. It takes two minutes and saves you that buried-four-clicks-deep frustration every single day. Small change, daily payoff.
GA4 Native vs Looker Studio
At some point you’ll wonder whether to graduate to Looker Studio. Here’s the honest dividing line.
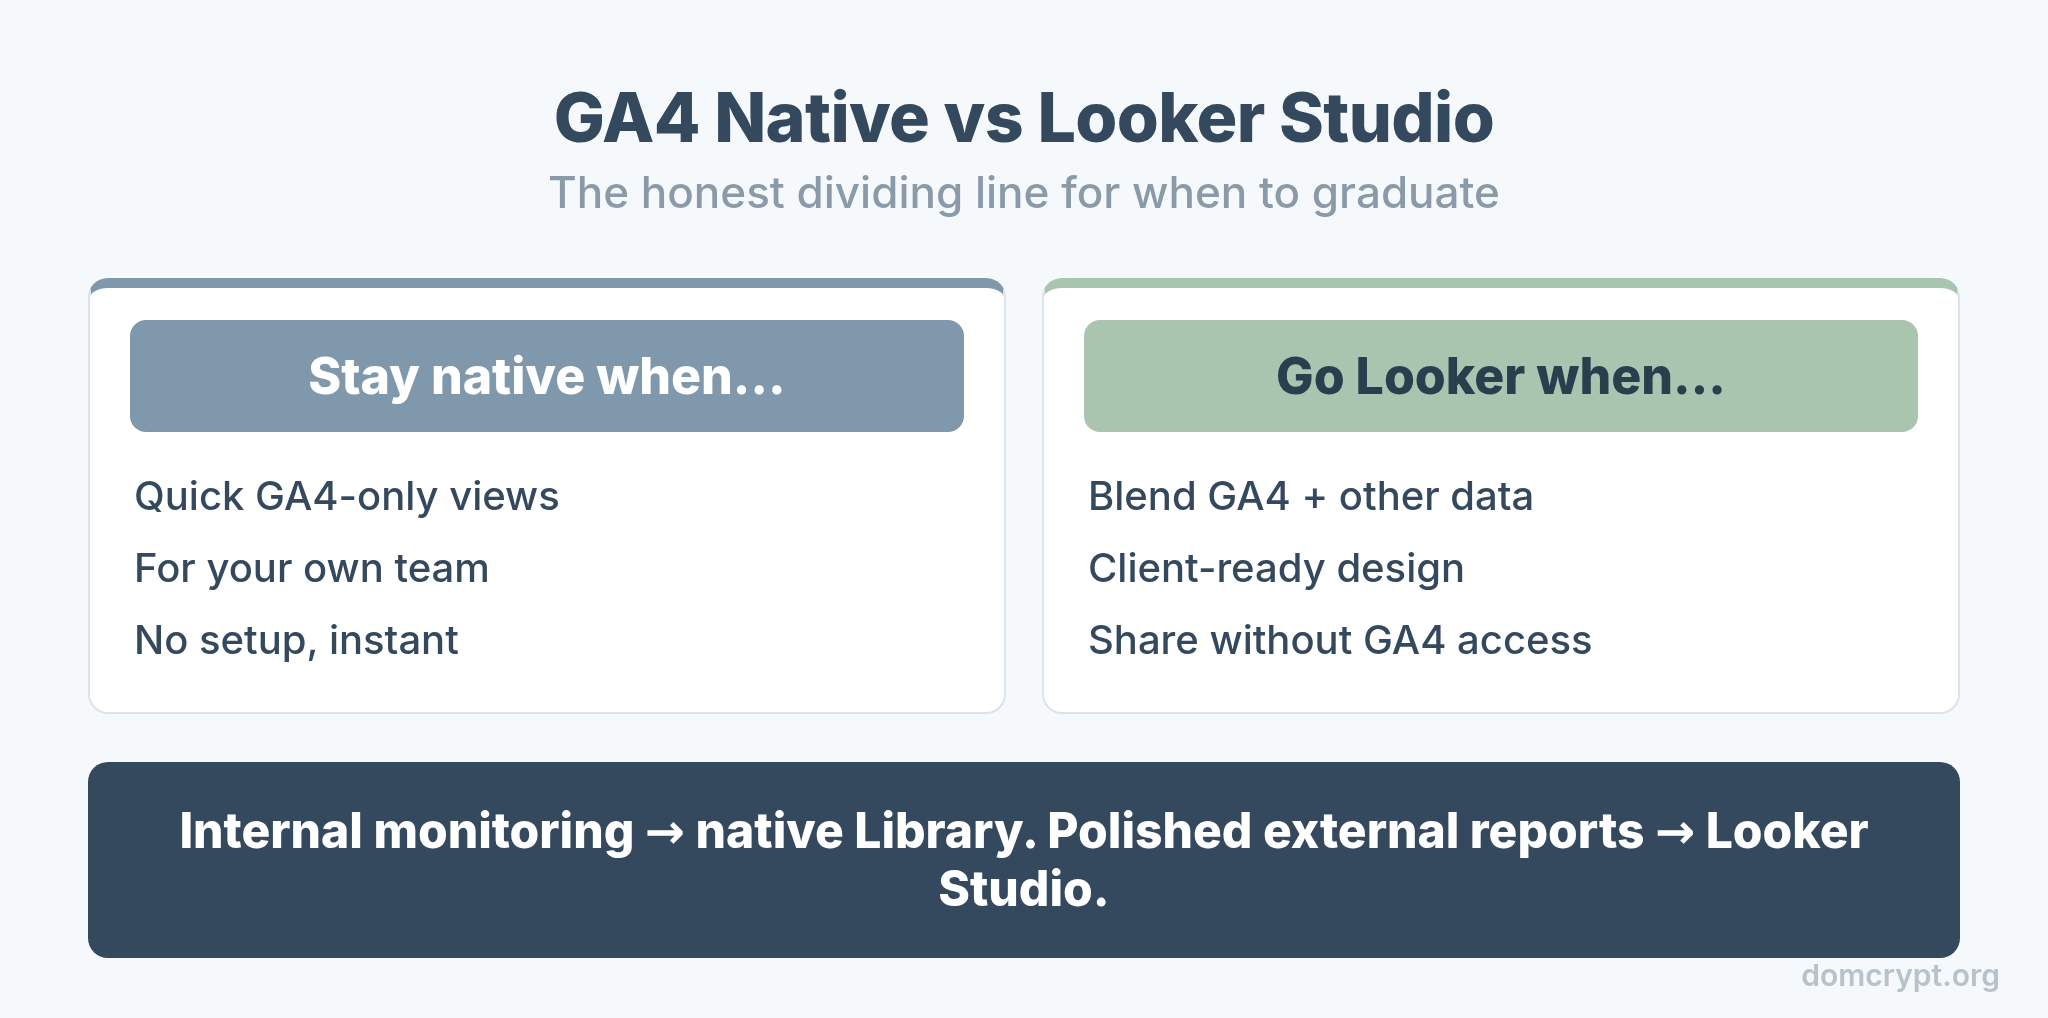
Stay native when you need quick, GA4-only views for your own team — it’s instant and requires no setup. Move to Looker Studio when you need to blend GA4 with other data sources, design client-ready reports, or share dashboards with people who don’t have GA4 access. Most internal monitoring lives happily in the native Library; polished external reporting is where Looker earns its place. The same diagnostic discipline applies wherever you build — a sudden swing usually means a tracking change, the same caution covered in bounce rate vs engagement rate.
The Bottom Line
You don’t need extra tools to make GA4 show the numbers you care about. Use the snapshot cards for a quick fix, edit detail reports for deeper control, and build a custom collection in the Library when you want your own section in the navigation. Choose the metrics by the question you ask most, keep the dashboard focused, and graduate to Looker Studio only when you need blended data or external sharing. Two minutes in the Library can save you four clicks every morning for the rest of the year.