Google Analytics 4: Complete Beginner’s Guide to GA4
Google Analytics 4 (GA4) replaced Universal Analytics in July 2023. If you’re setting up analytics for the first time — or trying to make sense of the new interface — this Google Analytics 4 guide covers everything you need to get started.
What is Google Analytics 4?
GA4 is Google’s current analytics platform, rebuilt from the ground up with a fundamentally different approach to tracking.
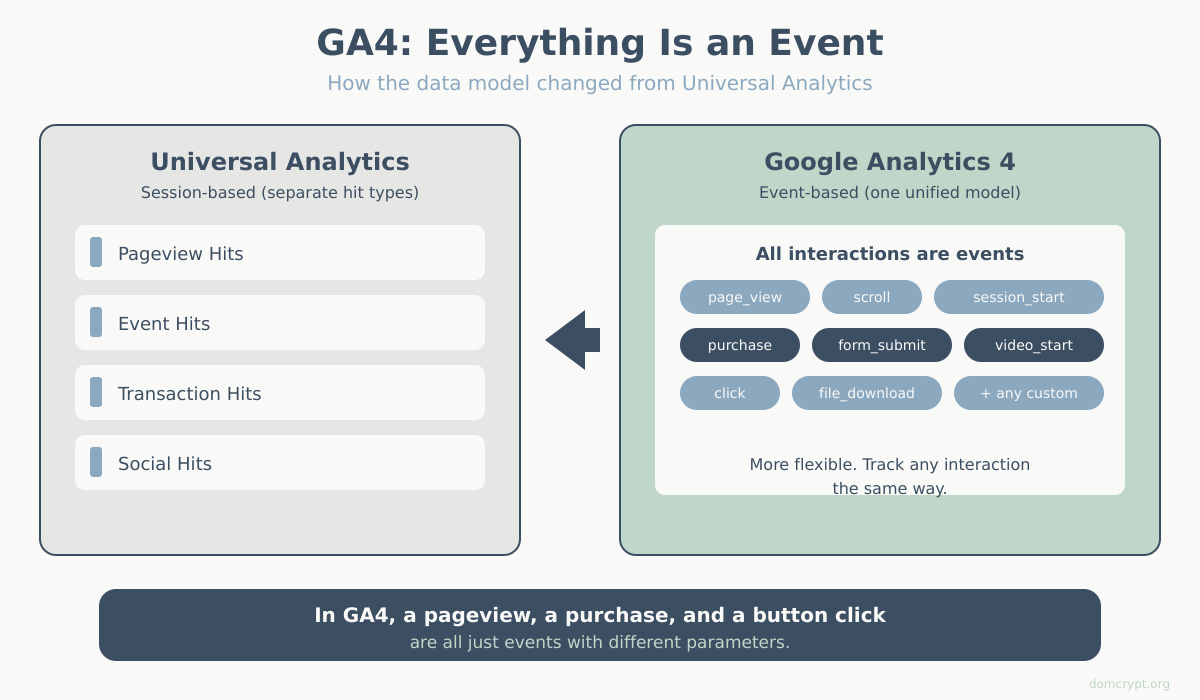
The biggest change: everything is an event. In the old Universal Analytics, pageviews, sessions, and events were separate concepts. In GA4, a pageview is just another event. A purchase is an event. A button click is an event.
This event-based model is more flexible. You can track virtually any user interaction without the rigid hit-type structure of the old system.
Why Google rebuilt analytics:
- Privacy changes are killing third-party cookies — GA4 is designed to work with less data
- Users move between devices and platforms — GA4 tracks user journeys, not just sessions
- Machine learning fills gaps — GA4 uses modeling to estimate data blocked by privacy tools
- App + web unified — one property can track both your website and mobile app
Google Analytics 4 vs Universal Analytics: Key Differences
If you used Universal Analytics before, GA4 will feel unfamiliar. Here’s what changed:
| Aspect | Universal Analytics | Google Analytics 4 |
|---|---|---|
| Data model | Session-based (hits) | Event-based (everything is an event) |
| Bounce rate | Core metric | Replaced by engagement rate |
| Goals | Separate goal configuration | Mark any event as a conversion |
| Views | Multiple views per property | No views — use filters and comparisons |
| Reports | Pre-built, detailed | Simplified defaults + Explorations |
| Data retention | Up to 50 months | 2 or 14 months (user-level data) |
| BigQuery | GA360 only (paid) | Free for all users |
The learning curve is real. Don’t expect to find the exact same reports in the same places — GA4 is a different product, not an upgrade.
Core Concepts in This Google Analytics 4 Guide
Before diving into reports, understand how GA4 thinks about data.
Events
An event is any user interaction you track. GA4 automatically collects some events (see Google’s automatically collected events documentation):
page_view— when a page loadsfirst_visit— user’s first visit to your sitesession_start— beginning of a sessionscroll— user scrolls to 90% of page (if enhanced measurement is on)click— outbound link clicksfile_download— clicks on file links
You can also create custom events for anything else: form submissions, video plays, button clicks.
Parameters
Events can have parameters — additional details attached to the event. For example, a purchase event might include parameters like:
value— purchase amountcurrency— USD, EUR, etc.items— products purchased
Parameters make events more useful. “User clicked a button” is okay; “User clicked the Add to Cart button on the pricing page” is actionable.
Users and Sessions
GA4 still tracks users and sessions, but with differences:
- Users are identified across devices when possible (if signed in or consent given)
- Sessions end after 30 minutes of inactivity, but don’t reset at midnight like UA
- Engaged sessions are sessions lasting 10+ seconds, with 2+ pageviews, or with a conversion
Engagement Rate vs Bounce Rate
GA4 replaced bounce rate with engagement rate — the percentage of engaged sessions. This is more useful because it measures positive behavior rather than just “left immediately.” For a full breakdown of the differences, see our guide to bounce rate vs engagement rate in GA4.
Engagement rate = Engaged sessions ÷ Total sessions
A session is “engaged” if it meets any of these criteria:
- Lasted longer than 10 seconds
- Had 2 or more pageviews
- Had a conversion event
Navigating the Google Analytics 4 Interface
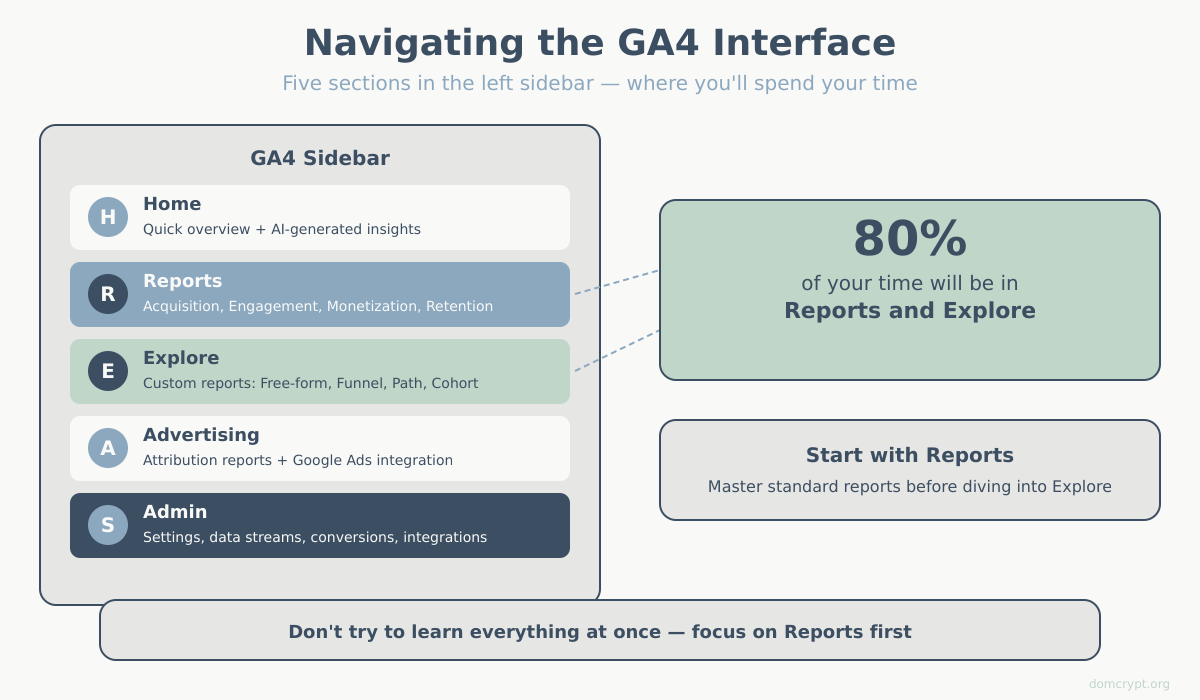
The left sidebar has five main sections:
Home
A dashboard with key metrics and AI-generated insights. Useful for a quick overview, but you’ll spend most time elsewhere.
Reports
Pre-built reports organized into categories:
- Realtime — what’s happening right now
- Acquisition — where users come from
- Engagement — what users do on your site
- Monetization — revenue and e-commerce data
- Retention — how often users return
- Demographics — who your users are
- Tech — devices, browsers, screen sizes
Explore
Explorations is where GA4 gets powerful. Build custom reports with drag-and-drop:
- Free-form exploration — custom tables and charts
- Funnel exploration — visualize step-by-step journeys
- Path exploration — see how users navigate your site
- Segment overlap — compare audience segments
- Cohort exploration — track user groups over time
This replaces many custom reports from Universal Analytics. The learning curve is steeper, but the flexibility is worth it.
Advertising
Attribution reports and Google Ads integration. Shows how different channels contribute to conversions across the customer journey.
Admin
Property settings, data streams, conversions, user management, and integrations. You’ll visit here for setup tasks but not daily reporting.
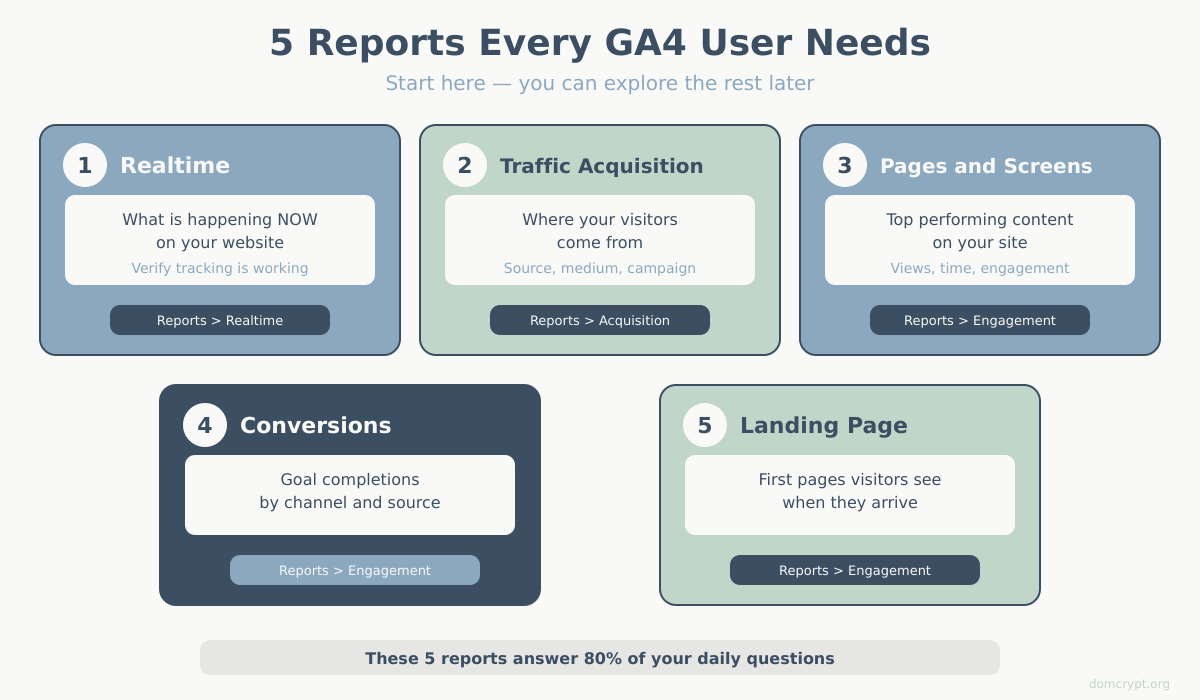
Essential Reports in Google Analytics 4
Start with these reports to understand your site’s performance:
Realtime Report
Path: Reports → Realtime
Shows activity in the last 30 minutes. Use it to:
- Verify tracking is working after setup
- Monitor traffic during campaigns or launches
- Debug events in real-time
Traffic Acquisition
Path: Reports → Acquisition → Traffic acquisition
Shows where your visitors come from. Key dimensions:
- Session source/medium — e.g., google/organic, facebook/referral
- Session campaign — UTM campaign names
This answers: “Which channels are driving traffic?”
Pages and Screens
Path: Reports → Engagement → Pages and screens
Shows your most viewed pages with engagement metrics. Answers: “What content is performing?”
Conversions Report
Path: Reports → Engagement → Conversions
Shows how many times each conversion event occurred and which channels drove them.
Landing Page Report
Path: Reports → Engagement → Landing page
Shows which pages users enter your site through. Critical for understanding SEO and ad performance.
Not sure which numbers to focus on? Our guide to the key website metrics that actually matter helps you prioritize.
Setting Up Conversions in Google Analytics 4
In GA4, any event can become a conversion. Here’s how:
Mark an existing event as a conversion:
- Go to Admin → Events
- Find the event you want (e.g.,
form_submit) - Toggle “Mark as conversion” to ON
Create a new conversion event:
If the event doesn’t exist yet:
- Go to Admin → Events → Create event
- Define conditions (e.g., event_name equals “purchase”)
- Save, then mark it as a conversion
Common conversions to track:
- Form submissions (leads)
- Purchases (e-commerce)
- Sign-ups (SaaS)
- Key page visits (e.g., pricing page, thank you page)
- File downloads
Google Analytics 4 Limitations to Know
GA4 is powerful, but it’s not perfect. Be aware of these issues:
Data retention limits
User-level data is only stored for 2 months by default (can extend to 14 months in settings). Aggregated reports aren’t affected, but Explorations using user-level data will lose older data.
Fix: Change retention to 14 months in Admin → Data Settings → Data Retention.
Sampling in Explorations
When you query large datasets in Explorations, GA4 may sample data (analyze a subset instead of everything). You’ll see a green/yellow/red indicator showing data quality.
Learning curve
The interface is genuinely harder to navigate than Universal Analytics. Reports are less detailed by default. You’ll need to build custom Explorations to get the same insights.
Attribution confusion
GA4 uses data-driven attribution by default, which can show different numbers than last-click attribution. Understand which model you’re looking at — our guide to attribution models in web analytics explains the differences.
Real-time data delays
Some reports can take 24-48 hours to fully populate. Don’t panic if today’s data looks incomplete.
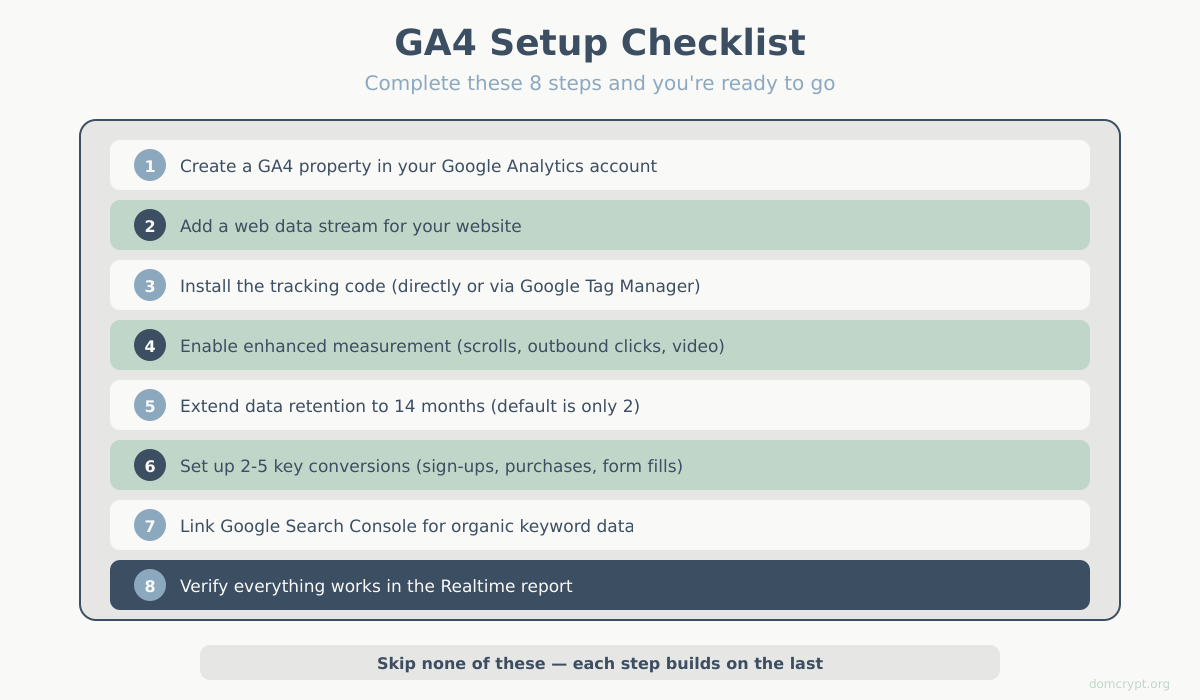
Getting Started with Google Analytics 4: Checklist
New to GA4? Follow this sequence:
- Create GA4 property — one property per website/app
- Add data stream — connect your website (gets you the Measurement ID)
- Install tracking code — via Google Tag Manager or directly in your site
- Enable enhanced measurement — auto-tracks scrolls, outbound clicks, file downloads
- Extend data retention — change from 2 months to 14 months
- Set up conversions — mark 2-5 key events as conversions
- Link Google Search Console — see organic search queries in GA4
- Verify data — use Realtime report to confirm tracking works
The Bottom Line
GA4 is a significant shift from Universal Analytics. The event-based model is more flexible, the privacy features are more robust, and the free BigQuery export is genuinely valuable.
But the interface takes getting used to, and some things that were easy in UA require more effort in GA4.
Start with the basics: install it, track your conversions, and check your acquisition and engagement reports weekly. The advanced features — Explorations, audiences, predictive metrics — can come later once you’re comfortable with the fundamentals.
Not sure if GA4 is right for you? Check our guide on how to choose the right analytics platform for your needs. New to analytics entirely? Start with what web analytics is and why it matters.