Shopping Cart Abandonment: How to Track and Reduce It with Analytics
Nearly 7 out of 10 online shoppers add items to their cart and leave without buying. That is not a rounding error — it is the majority of your potential revenue walking out the door. The gap between “add to cart” and “purchase complete” is where most e-commerce businesses lose the most money, and it is also where analytics can make the biggest difference.
This guide covers everything you need to go from “I think we have an abandonment problem” to “I know exactly where people drop off and what to do about it.” We will set up proper tracking, build funnel reports, diagnose the real reasons shoppers leave, and implement strategies that actually bring them back.
What Is Shopping Cart Abandonment?
Shopping cart abandonment happens when a visitor adds at least one item to their online shopping cart but leaves the site before completing the purchase. The key distinction: the shopper showed clear buying intent by adding a product, then did not follow through.
This is different from two related concepts that often get mixed up:
- Browse abandonment — a visitor views product pages but never adds anything to the cart. They were window-shopping, not cart-shopping.
- Checkout abandonment — a visitor starts the checkout process (enters shipping info, for example) but does not complete payment. This is a subset of cart abandonment and usually signals a more specific friction point.
Understanding which type of abandonment you are dealing with matters because the fixes are completely different. Browse abandonment is a merchandising and product page problem. Cart abandonment is a pricing, trust, and checkout experience problem. Checkout abandonment is often a payment or form design problem.
For tracking purposes, the formula is straightforward:
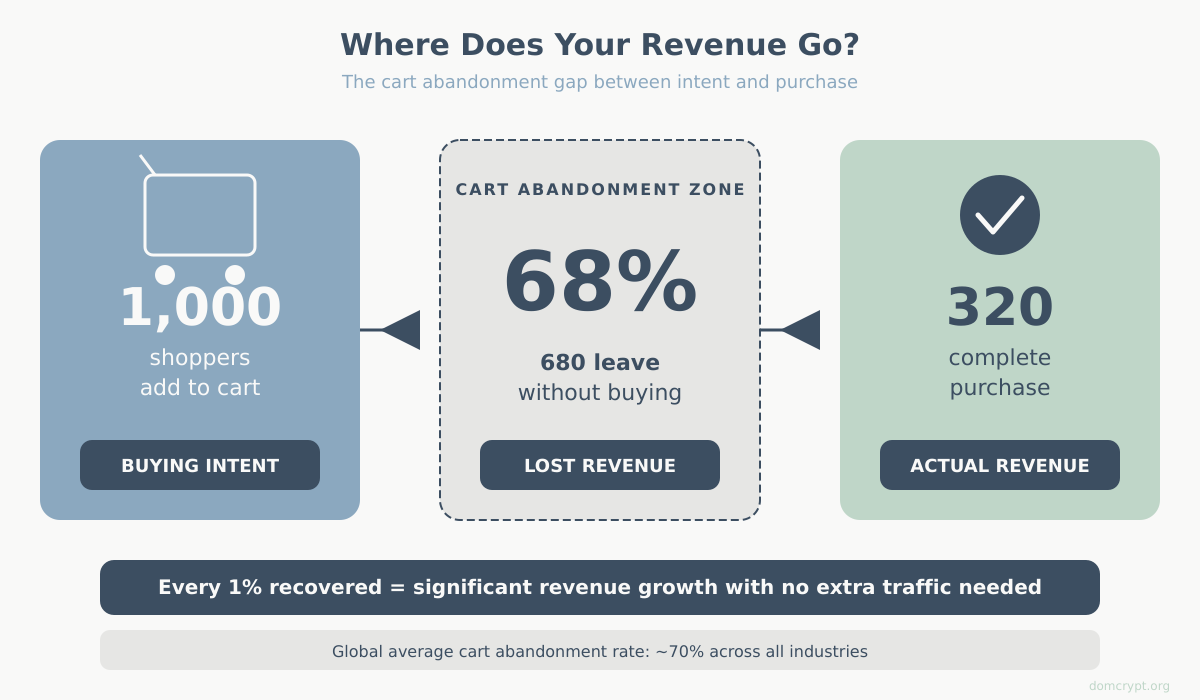
Cart Abandonment Rate = (Carts Created – Purchases Completed) / Carts Created x 100
If 1,000 people add items to their cart and 320 complete a purchase, your cart abandonment rate is 68%. That number alone does not tell you much — you need context. Which brings us to benchmarks.
Cart Abandonment Benchmarks: What’s Normal?
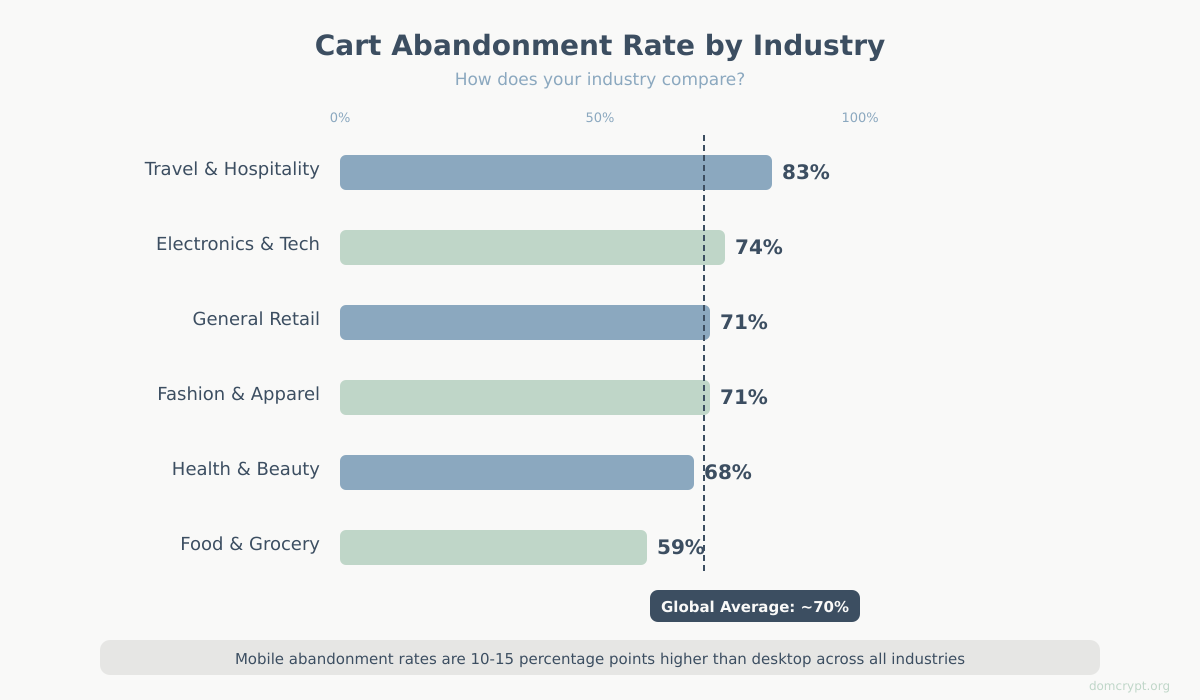
Before you panic about your abandonment rate, you need to know what “normal” looks like. Spoiler: it is high everywhere. The global average cart abandonment rate hovers around 69-70% across all industries. But averages hide important differences.
| Industry | Average Abandonment Rate |
|---|---|
| Travel & Hospitality | 81-85% |
| Fashion & Apparel | 68-74% |
| Electronics & Tech | 72-76% |
| Health & Beauty | 65-70% |
| Food & Grocery | 55-62% |
| General Retail | 69-73% |
Several factors push these numbers around:
- Device: Mobile abandonment rates are consistently 10-15 percentage points higher than desktop. Small screens, harder form-filling, and slower load times all contribute.
- Average order value: Higher-priced items see more abandonment. A $15 t-shirt gets less deliberation than a $1,200 laptop.
- New vs. returning visitors: First-time visitors abandon at significantly higher rates because they have not yet built trust with your store.
- Region: Markets with lower credit card penetration or more complex payment ecosystems tend to have higher abandonment.
Your goal is not to reach 0% abandonment — that is impossible. Some people use carts as wish lists, some are comparing prices, and some were never going to buy today. A realistic goal is to reduce your rate by 5-15 percentage points from your current baseline, which can translate to a massive revenue increase. On a store doing $500K/year with a 70% abandonment rate, dropping to 60% could mean roughly $165K in recovered revenue.
Why Do Shoppers Abandon Carts?
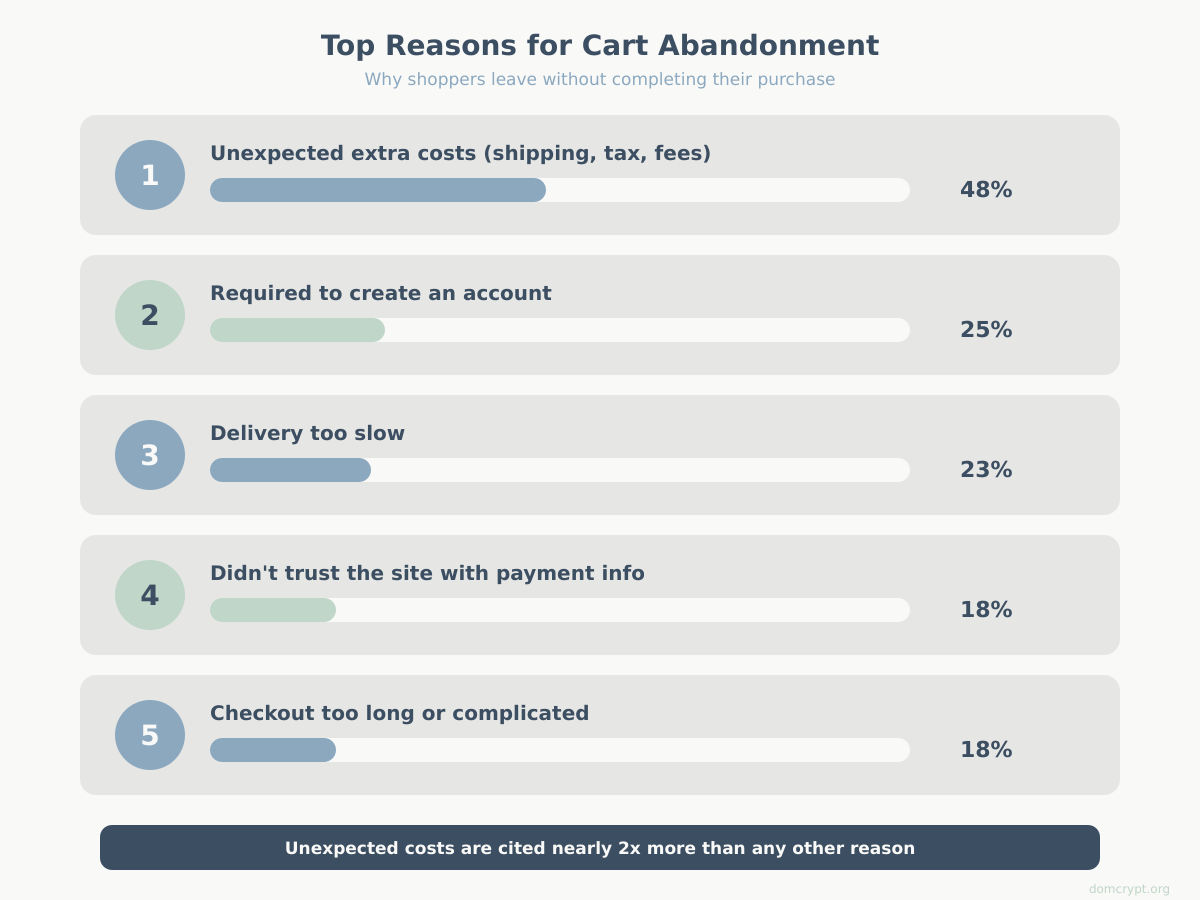
You cannot fix what you do not understand. Research consistently points to the same set of reasons, though the ranking varies slightly by study. Here are the most common causes, ordered by how frequently shoppers cite them:
| Rank | Reason | % of Shoppers Citing It |
|---|---|---|
| 1 | Unexpected extra costs (shipping, tax, fees) | 47-49% |
| 2 | Required to create an account | 24-26% |
| 3 | Delivery too slow | 22-24% |
| 4 | Did not trust the site with payment info | 17-19% |
| 5 | Checkout process too long or complicated | 17-18% |
| 6 | Could not see total cost upfront | 16-17% |
| 7 | Return policy not satisfactory | 11-12% |
| 8 | Website errors or crashes | 11-12% |
| 9 | Not enough payment options | 7-9% |
| 10 | Credit card was declined | 4-5% |
Notice that the number one reason — unexpected costs — is almost twice as common as the second. This is the single most impactful thing to address. Also notice that many of these reasons are about friction and trust, not about the product itself. The shopper already wants the item. Your checkout experience is losing them.
The analytics angle here is critical: your data should help you figure out which of these reasons applies to your store. A high drop-off right at the shipping cost reveal means reason #1. A drop-off at account creation means reason #2. This is why proper funnel tracking matters — it translates these general statistics into specific, actionable problems for your business.
How to Track Cart Abandonment in GA4
If you are using Google Analytics 4, you already have the framework for cart abandonment tracking built in. GA4’s e-commerce measurement model is designed around a sequence of events that map directly to the shopping journey. The challenge is making sure those events actually fire correctly on your site.
The E-commerce Event Sequence
GA4 uses a specific chain of recommended e-commerce events. Each event represents a step in the buying process:
view_item— Visitor views a product detail pageadd_to_cart— Visitor adds a product to their cartview_cart— Visitor views their cart (optional but useful)begin_checkout— Visitor starts the checkout processadd_shipping_info— Visitor submits shipping detailsadd_payment_info— Visitor enters payment informationpurchase— Transaction completes successfully
Cart abandonment lives in the gap between add_to_cart and purchase. Checkout abandonment is the gap between begin_checkout and purchase. By tracking all these events, you get a complete picture of where exactly people give up.
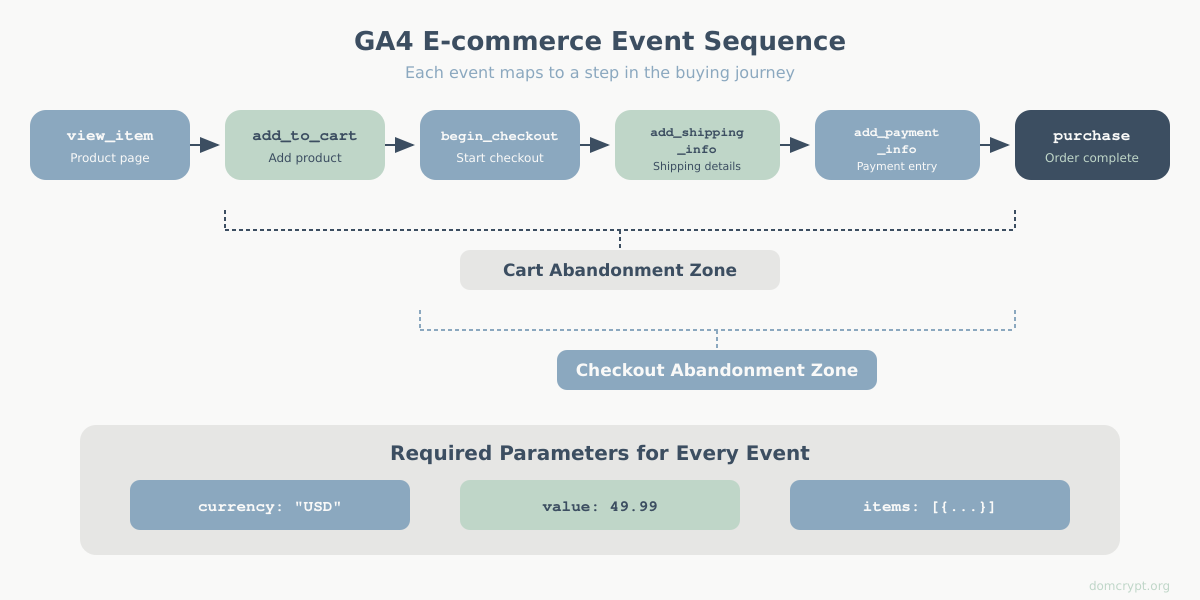
Each event should carry specific parameters. At minimum, every e-commerce event needs:
currency— the 3-letter currency code (e.g., “USD”)value— the total monetary valueitems— an array of product objects withitem_id,item_name,price, andquantity
Setting Up the Data Layer
The cleanest way to implement e-commerce tracking is through the data layer — a JavaScript object that your website pushes event data into, which Google Tag Manager then picks up and sends to GA4. If you are not familiar with GTM, read the setup guide first.
Here is what the data layer push looks like for the key cart-related events:
Add to Cart event:
dataLayer.push({
  event: "add_to_cart",
  ecommerce: {
    currency: "USD",
    value: 49.99,
    items: [{
      item_id: "SKU-12345",
      item_name: "Blue Running Shoes",
      price: 49.99,
      quantity: 1,
      item_category: "Footwear",
      item_brand: "BrandName"
    }]
  }
});
Begin Checkout event:
dataLayer.push({
  event: "begin_checkout",
  ecommerce: {
    currency: "USD",
    value: 89.98,
    items: [{
      item_id: "SKU-12345",
      item_name: "Blue Running Shoes",
      price: 49.99,
      quantity: 1
    },
    {
      item_id: "SKU-67890",
      item_name: "Sports Socks Pack",
      price: 39.99,
      quantity: 1
    }]
  }
});
Purchase event:
dataLayer.push({
  event: "purchase",
  ecommerce: {
    transaction_id: "TXN-20260210-001",
    currency: "USD",
    value: 94.97,
    tax: 4.99,
    shipping: 0,
    items: [{
      item_id: "SKU-12345",
      item_name: "Blue Running Shoes",
      price: 49.99,
      quantity: 1
    },
    {
      item_id: "SKU-67890",
      item_name: "Sports Socks Pack",
      price: 39.99,
      quantity: 1
    }]
  }
});
In GTM, you create a GA4 Event tag for each of these events, triggered by the corresponding dataLayer.push. Map the ecommerce parameters to GA4 event parameters. Google’s GA4 e-commerce implementation guide provides the full parameter schema, but the examples above cover the essentials.
Important: Always push { ecommerce: null } before each new ecommerce event to clear the previous ecommerce object from the data layer. This prevents stale data from bleeding between events:
dataLayer.push({ ecommerce: null });
dataLayer.push({
  event: "begin_checkout",
  ecommerce: { ... }
});
For more details on data layer implementation, refer to the official GTM documentation.
Calculating Your Cart Abandonment Rate
Once your events are firing, you can calculate your cart abandonment rate directly from GA4 data:
Cart Abandonment Rate = (add_to_cart events – purchase events) / add_to_cart events x 100
To pull these numbers in GA4:
- Go to Reports > Monetization > E-commerce purchases for a high-level view
- For precise event counts, open Explore > Free-form exploration
- Add “Event name” as a dimension and “Event count” as a metric
- Filter to show only
add_to_cartandpurchaseevents - Calculate the rate: (add_to_cart count – purchase count) / add_to_cart count x 100
Note that this gives you an event-based rate, not a user-based rate. One user might trigger multiple add_to_cart events in a session. For a user-based rate, switch the metric to “Total users” instead of “Event count.” The user-based rate is generally more meaningful for understanding actual buyer behavior, while the event-based rate is useful for understanding cart interaction volume.
Building a Checkout Funnel Report
Knowing your overall abandonment rate is a start. But the real diagnostic power comes from building a funnel report that shows exactly where in the checkout process people drop off. This is what turns a vague “we have an abandonment problem” into a specific “we lose 34% of users between shipping info and payment info.”
Funnel Exploration Setup
GA4’s Funnel exploration is purpose-built for this. Here is how to set it up:
- In GA4, go to Explore and create a new Funnel exploration
- Under “Steps,” add your e-commerce events in order:
- Step 1:
view_item(product page view) - Step 2:
add_to_cart - Step 3:
begin_checkout - Step 4:
add_shipping_info - Step 5:
add_payment_info - Step 6:
purchase
- Step 1:
- Toggle “Make open funnel” OFF — you want to see users who went through the steps in sequence
- Set your date range (at least 30 days for meaningful data)
- Apply a segment if needed (e.g., mobile users only, or a specific traffic source)
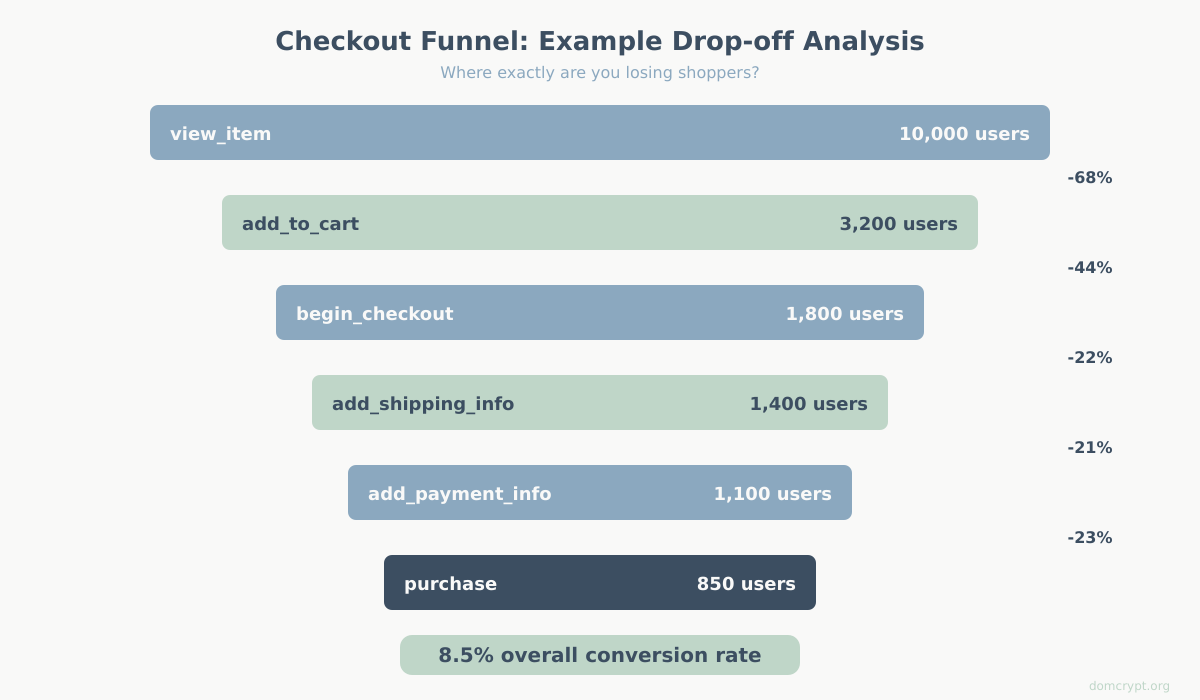
GA4 will display a bar chart showing the number of users at each step and the drop-off percentage between steps. This is your diagnostic x-ray of the checkout process.
Reading the Funnel: Where Are You Losing People?
When you look at your funnel, pay attention to the biggest single drop-off between any two consecutive steps. That is your highest-priority problem.
Here is how to interpret common patterns:
- Huge drop between view_item and add_to_cart (over 85%) — This is not cart abandonment; it is a product page problem. Your pricing, product descriptions, images, or reviews are not compelling enough.
- Big drop between add_to_cart and begin_checkout (over 50%) — Shoppers are using the cart as a wish list, or your cart page is introducing unexpected costs. Check if shipping estimates or taxes appear for the first time on the cart page.
- Drop at begin_checkout to add_shipping_info (over 30%) — The checkout start page is scaring people off. Common causes: required account creation, too many form fields visible at once, or the first page asks for too much information.
- Drop at add_shipping_info to add_payment_info (over 25%) — Shipping costs or delivery times are the problem. This is where shoppers see actual shipping prices and decide “not worth it.”
- Drop at add_payment_info to purchase (over 15%) — Payment friction. Not enough payment options, security concerns, or card declines. Check if you support digital wallets (Apple Pay, Google Pay, PayPal).
Break down your funnel by device category (desktop vs. mobile vs. tablet) and by traffic source. You may find that your mobile funnel has a much bigger drop-off at the payment step because form-filling on a phone is painful. Or that paid traffic abandons more at the cart page because they did not expect the shipping cost that was not mentioned in the ad.
To dig deeper into key metrics at each stage, you can combine the funnel exploration with segment overlaps to see which user attributes correlate with completion vs. abandonment.
Common Mistakes in Cart Abandonment Tracking
Getting e-commerce tracking right is harder than it looks. Here are the mistakes that most commonly produce misleading data:
1. Duplicate event firing. The purchase event fires twice on the confirmation page (because of a page reload, or the tag fires on the thank-you page and the order confirmation page). This inflates purchase counts and makes your abandonment rate look lower than it really is. Fix: use a transaction ID check — if GA4 has already received that transaction_id, it deduplicates automatically. Make sure you are always passing a unique transaction_id.
2. Missing currency parameter. If you do not send the currency parameter with your e-commerce events, GA4 will not attribute monetary values correctly. The events will show up in reports, but revenue data will be missing or wrong.
3. Not clearing the ecommerce object. Failing to push { ecommerce: null } before each new event causes the previous event’s item data to persist. A begin_checkout event might carry items from a previous add_to_cart push that the user already removed.
4. Counting sessions instead of users. A single user might visit your store three times before buying. If you count each session as a separate “abandoned cart,” your abandonment rate is artificially inflated. Always compare using user-level metrics when calculating the business impact.
5. Ignoring cross-device journeys. A shopper browses on their phone during lunch and buys on their laptop at home. Without GA4’s cross-device user-ID or Google Signals, this looks like one abandoned cart on mobile and an unrelated purchase on desktop. If you have user authentication on your site, implement User-ID tracking to connect these sessions.
6. Not tracking the view_cart event. Many implementations skip view_cart because it is not strictly required. But without it, you cannot distinguish between “added to cart and left immediately” vs. “added to cart, reviewed the cart, and then left.” These are different behaviors with different solutions.
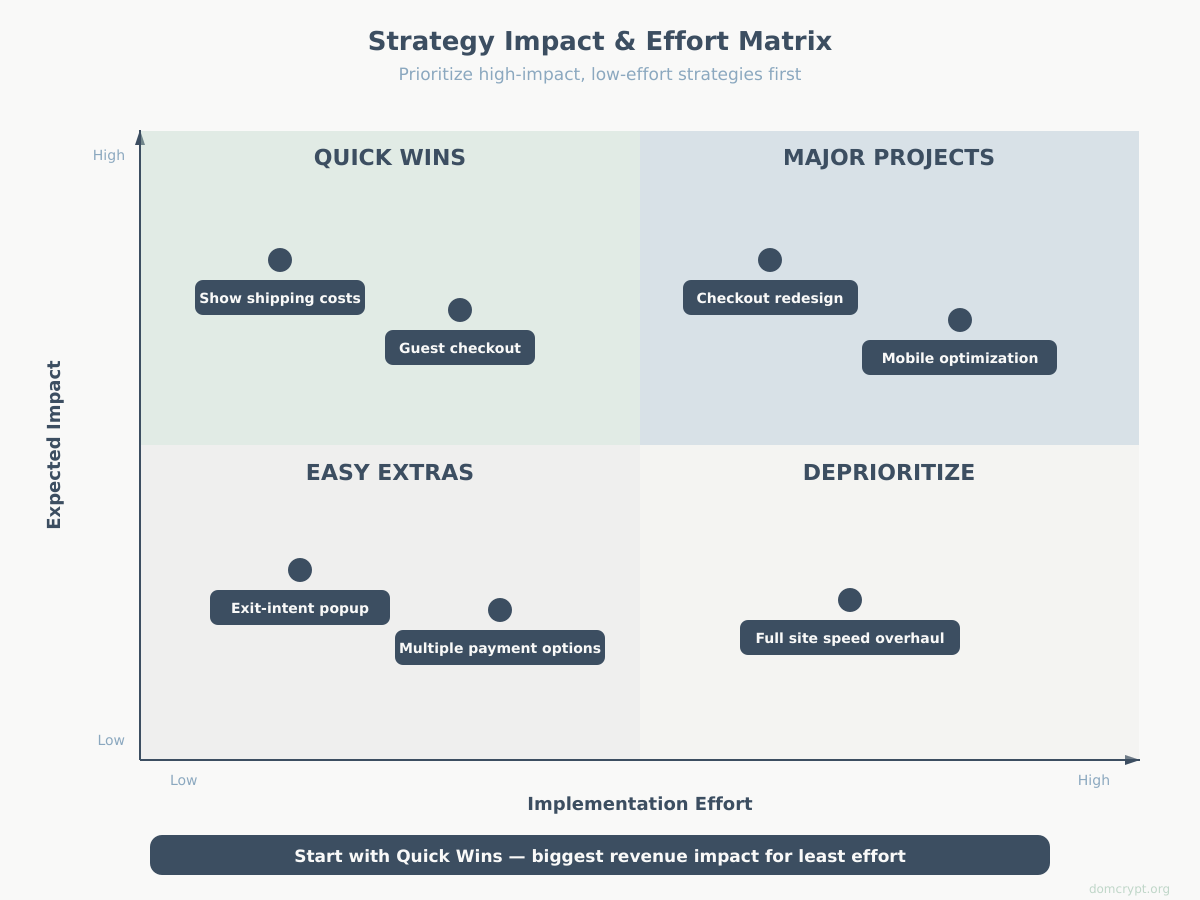
10 Proven Strategies to Reduce Cart Abandonment
Now for the part everyone wants: how to bring that abandonment rate down. These strategies are ordered roughly by impact and ease of implementation. Start from the top and work down.
1. Reduce Unexpected Costs
This is the single most effective change you can make. If shoppers are surprised by shipping costs, taxes, or fees at checkout, they leave. Solutions:
- Show shipping costs on the product page or in the cart — never wait until checkout
- Offer free shipping with a clearly displayed minimum order threshold (“Free shipping on orders over $50”)
- Include tax estimates based on the visitor’s location before they start checkout
- If you charge handling fees, bundle them into the product price instead of adding them as a line item
2. Simplify the Checkout Flow
Every additional form field or page in your checkout is a chance for the shopper to reconsider. The best-converting checkouts are short:
- Aim for a single-page checkout or a maximum of 3 steps
- Only ask for information you absolutely need to fulfill the order
- Use address auto-complete to reduce typing
- Show a progress indicator so shoppers know how close they are to done
3. Offer Guest Checkout
Requiring account creation is the second most common reason for abandonment. Let people buy without creating an account. You can always ask them to create one after the purchase is complete, on the confirmation page, when the barrier is lowest (“Save your details for faster checkout next time”).
4. Build Trust at the Checkout
Shoppers who do not trust your site with their credit card will not complete the purchase, no matter how smooth your checkout is:
- Display security badges (SSL certificate, PCI compliance, trusted payment processor logos)
- Show your return and refund policy prominently — link to it from the checkout page
- Include customer reviews or trust scores visible during checkout
- Use a professional, clean checkout design — visual quality signals legitimacy
5. Optimize for Mobile
Mobile accounts for 60-70% of e-commerce traffic but converts at roughly half the rate of desktop. The checkout experience on a phone needs specific attention:
- Use large touch targets for buttons and form fields (minimum 44×44 pixels)
- Auto-select the correct keyboard type (numeric for phone/card numbers, email for email fields)
- Support autofill and digital wallets — Apple Pay and Google Pay can replace the entire form
- Test your checkout on actual phones, not just browser emulators
6. Add Multiple Payment Options
If a shopper’s preferred payment method is not available, they are likely to leave. At minimum, support:
- Major credit/debit cards
- PayPal or similar digital wallets
- Apple Pay and Google Pay for mobile
- Buy Now, Pay Later (BNPL) options like Klarna, Afterpay, or Affirm — especially for higher-priced items
7. Use Exit-Intent Interventions
When a user’s mouse moves toward the browser close button (on desktop) or they switch tabs, an exit-intent popup can be triggered. Use it sparingly and with a genuine offer:
- A small discount code (“Complete your purchase now and save 10%”)
- Free shipping upgrade
- A reminder of what is in their cart
Do not use exit-intent popups to collect emails with no offer. That creates friction, not recovery.
8. Send Abandoned Cart Emails
For shoppers who provide their email before abandoning, a well-timed email sequence is one of the highest-ROI recovery tactics:
- Email 1 (1 hour after abandonment): Simple reminder with cart contents. No discount yet.
- Email 2 (24 hours): Address common objections — highlight return policy, customer reviews, shipping details.
- Email 3 (48-72 hours): Offer an incentive if the first two emails did not convert — a small discount or free shipping.
Track these emails using UTM parameters so you can measure their performance in GA4. Tag each email with unique campaign parameters (utm_medium=email, utm_campaign=cart_recovery, utm_content=email_1) to see which email in the sequence drives the most recoveries.
9. Retarget with Ads
Not every abandoner gives you their email. For the rest, retargeting ads on platforms like Google Ads, Meta, or display networks can bring them back. Build an audience segment of users who triggered add_to_cart but not purchase and serve them dynamic product ads showing the items they left behind.
Keep the retargeting window reasonable — 7 to 14 days. Beyond that, the purchase intent has likely expired, and you are just spending money to annoy people. Understanding attribution models will help you accurately measure how much revenue your retargeting campaigns actually recover vs. what would have happened anyway.
10. Speed Up Your Site
Every second of page load time during checkout increases abandonment. This is especially true on mobile with slower connections:
- Target under 3 seconds for checkout page load
- Lazy-load non-critical resources
- Minimize redirects in the checkout flow
- Use a Content Delivery Network (CDN) for static assets
Measuring the Impact of Your Changes
Implementing fixes without measuring their impact is guessing, not optimizing. Here is how to set up a measurement framework for your cart abandonment reduction efforts.
First, establish your baseline. Record your current cart abandonment rate, checkout abandonment rate, and overall e-commerce conversion rate for at least 30 days before making changes. These are your “before” numbers.
For each change you implement, track it as a distinct initiative:
| Change | How to Measure | What to Watch |
|---|---|---|
| Showing shipping costs on product page | Compare cart-to-checkout drop-off before/after | Drop-off between add_to_cart and begin_checkout should decrease |
| Added guest checkout | Compare begin_checkout to purchase rate before/after | Checkout completion rate should increase |
| Cart recovery emails | UTM-tagged links, track purchases from email | Revenue attributed to email recovery campaign |
| Retargeting ads | UTM-tagged ad links, conversion tracking | ROAS on retargeting campaign, incremental purchases |
| Mobile checkout redesign | Segment funnel by device, compare before/after | Mobile checkout completion rate should increase |
| Added payment options | Compare payment step drop-off before/after | Drop-off at add_payment_info should decrease |
If you have enough traffic, run A/B tests instead of before-and-after comparisons. A/B tests eliminate the noise of seasonality and other changes happening on your site at the same time. Even a simple 50/50 split between the old checkout and the new checkout, run for 2-4 weeks, will give you much more reliable data than comparing this month to last month.
Set up goals and conversions in GA4 for each micro-conversion in the checkout flow (not just the final purchase). This lets you track improvements at every step, not just the end result. If your overall purchase rate did not change but the drop-off at shipping info decreased while the drop-off at payment increased, you need to know that — something you broke at the payment step might be canceling out your shipping improvement.
Quick-Start Checklist
Here is a practical checklist to get you from zero to active cart abandonment tracking and recovery. Work through it in order:
Week 1 — Set Up Tracking:
- Implement the full GA4 e-commerce event sequence via the data layer and GTM
- Verify all events are firing correctly using GTM Preview mode and GA4 DebugView
- Confirm the
currency,value, anditemsparameters are populated for every event - Build a Funnel exploration report in GA4 with all checkout steps
- Record your baseline cart abandonment rate and checkout abandonment rate
Week 2 — Diagnose:
- Identify the single biggest drop-off point in your funnel
- Segment the funnel by device type — check if mobile is significantly worse
- Segment by traffic source — check if any channel has unusually high abandonment
- Review your checkout flow manually on desktop and mobile — note any friction points
Week 3 — Implement Quick Wins:
- Address the top drop-off point (likely unexpected costs or checkout complexity)
- Enable guest checkout if not already available
- Set up an abandoned cart email sequence (even a single reminder email is a start)
- Tag all recovery emails with UTM parameters for tracking
Week 4 and Beyond — Measure and Iterate:
- Compare your new funnel data to your baseline after at least 2 weeks of data
- Calculate the revenue impact of your changes
- Pick the next highest-impact strategy from the list and implement it
- Continue monitoring weekly — cart abandonment is not a “set it and forget it” metric
Cart abandonment will never reach zero, and that is fine. The goal is to systematically identify where your checkout leaks money, plug the biggest holes first, and keep measuring. Every percentage point you recover goes straight to your bottom line — and unlike acquiring new traffic, recovering existing cart abandoners costs significantly less per sale.