10 Key Website Metrics That Actually Matter (And How to Track Them)
If you’ve ever opened Google Analytics and felt overwhelmed by the sheer number of metrics available, you’re not alone. Most website owners track dozens of data points without knowing which ones actually drive decisions.
This guide cuts through the noise. You’ll learn the 10 most important website metrics that directly impact your business, how to interpret them, and where to find them in Google Analytics 4.
Why Most Website Owners Track the Wrong Metrics
It’s easy to get excited about big numbers. Watching your total pageviews climb month after month feels good. But pageviews alone don’t tell you if your website is actually working.
These are called vanity metrics — numbers that look impressive but don’t help you make better decisions. A website with 100,000 monthly visitors and zero conversions has a problem, even if the traffic graph looks great.
Actionable metrics are different. They’re tied to specific business outcomes and tell you what to fix, what to double down on, or when to pivot your strategy.
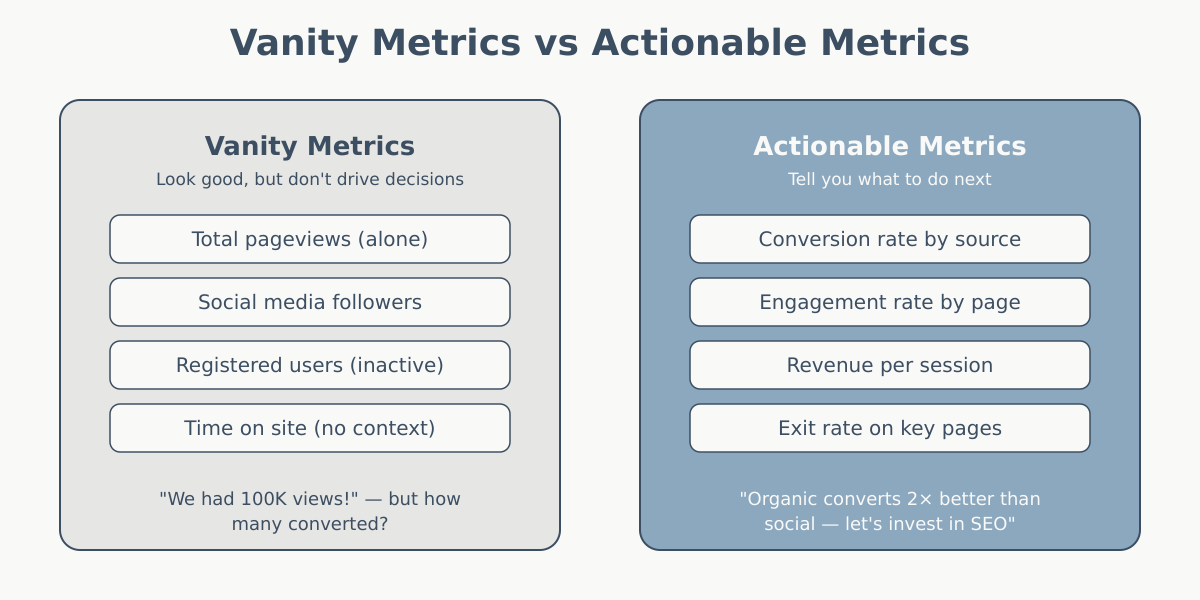
The difference matters. Tracking the wrong metrics wastes time and can lead you to optimize for things that don’t move the needle.
What Makes a Metric Actually Matter?
Before we dive into the list, here’s the framework. A metric “matters” if it meets three criteria:
- Tied to a business goal — It connects directly to revenue, leads, engagement, or another outcome you care about.
- Actionable — You can do something specific based on what the metric tells you.
- Consistently measurable — You can track it reliably over time without major data quality issues.
If a metric doesn’t meet all three, it’s probably not worth your attention.
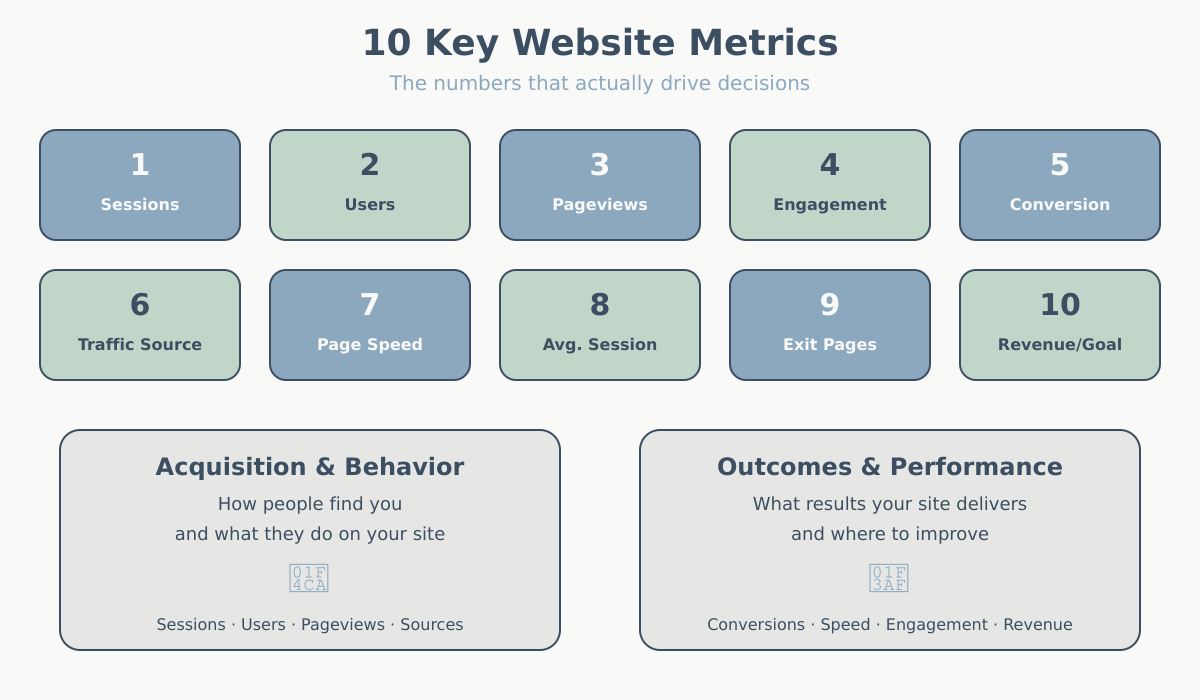
The 10 Website Metrics You Should Actually Track
These metrics are organized into three categories: acquisition (how people find you), engagement (what they do on your site), and conversion (whether they take action).
Each metric includes what it is, why it matters, typical benchmarks, and where to find it in GA4.
1. Traffic by Source/Medium
What it is: A breakdown of where your visitors come from — organic search, paid ads, social media, direct visits, referrals, or email campaigns. In GA4, “source” is the origin (like “google” or “facebook”) and “medium” is the channel type (like “organic” or “cpc”).
Why it matters: This metric tells you which marketing channels are actually working. If you’re spending money on Facebook ads but most conversions come from organic search, you know where to invest more effort. Pairing source data with attribution models reveals the full picture of how each channel contributes to conversions.
Benchmarks: This varies wildly by industry, but a healthy mix usually includes:
- Organic search: 30-50% for content-driven sites
- Direct: 20-40% (includes branded searches and repeat visitors)
- Referral: 5-15%
- Paid: varies based on budget
Where to find it in GA4: Reports → Acquisition → Traffic acquisition. You can also add “Session source/medium” as a dimension in any exploration.

2. Conversion Rate
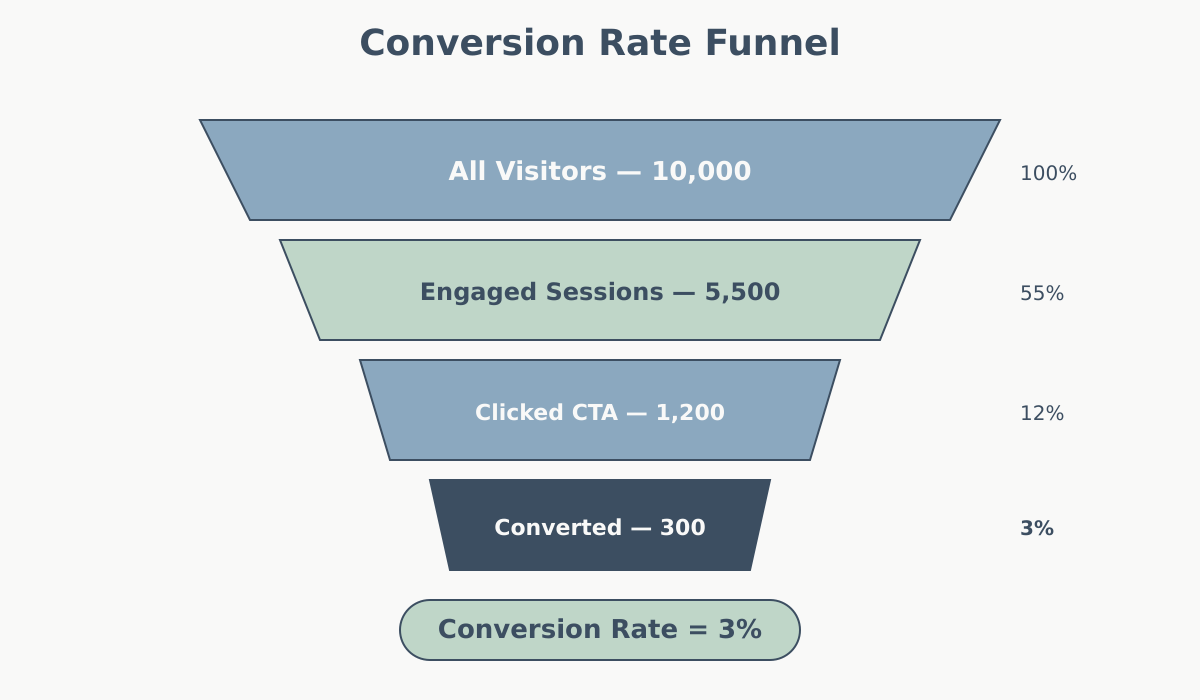
What it is: The percentage of visitors who complete a desired action — like filling out a form, making a purchase, or signing up for a newsletter. It’s calculated as (conversions ÷ total sessions) × 100.
Why it matters: Conversion rate is the single most important metric for most websites. High traffic means nothing if nobody takes action. A 1% improvement in conversion rate often has a bigger impact than a 10% increase in traffic.
Benchmarks:
- E-commerce sites: 2-4% average, 5%+ is strong
- Lead generation (B2B): 2-5% for form submissions
- SaaS free trial signups: 3-7%
- Newsletter signups: 1-3%
Where to find it in GA4: Reports → Engagement → Conversions (if you’ve set up conversion events). You can also view conversion rate by traffic source in the Traffic acquisition report.
Note: GA4 requires you to manually mark events as “conversions” in the Events section. Make sure your key goals are configured correctly.
3. Pages per Session
What it is: The average number of pages a user views during a single session. Calculated as total pageviews divided by total sessions.
Why it matters: This metric indicates how engaging your content is and whether your site structure helps users find what they need. Low pages per session on a blog might mean your content isn’t compelling. High pages per session on an e-commerce site could mean navigation is confusing.
Benchmarks:
- Blogs and content sites: 2-4 pages per session is typical; 5+ is excellent
- E-commerce: 4-6 pages (depends on product discovery)
- SaaS landing pages: 1.5-2.5 (single-purpose pages should be lower)
- Service websites: 2-3 pages
Where to find it in GA4: Reports → Engagement → Pages and screens. You can also see “Views per session” in custom explorations.
Context is critical here. A one-page checkout landing page should have a low pages-per-session score if it converts well.
4. Average Session Duration
What it is: The average amount of time users spend on your site during a session. In GA4, this is calculated based on engaged sessions (sessions that last longer than 10 seconds, have a conversion event, or include at least 2 pageviews).
Why it matters: Session duration helps you understand if users are actually engaging with your content or bouncing quickly. Like pages per session, the “good” number depends entirely on your site’s purpose.
Benchmarks:
- Blogs and educational content: 2-4 minutes is typical; 5+ minutes is strong
- E-commerce: 3-5 minutes (product research takes time)
- Landing pages: 1-2 minutes (should be focused and clear)
- SaaS pricing pages: 1-3 minutes
Where to find it in GA4: Reports → Engagement → Pages and screens shows “Average engagement time.” For overall session duration, create a custom exploration with the “Session duration” metric.
Don’t obsess over this metric in isolation. A 30-second session that results in a purchase is infinitely more valuable than a 10-minute session with no action.
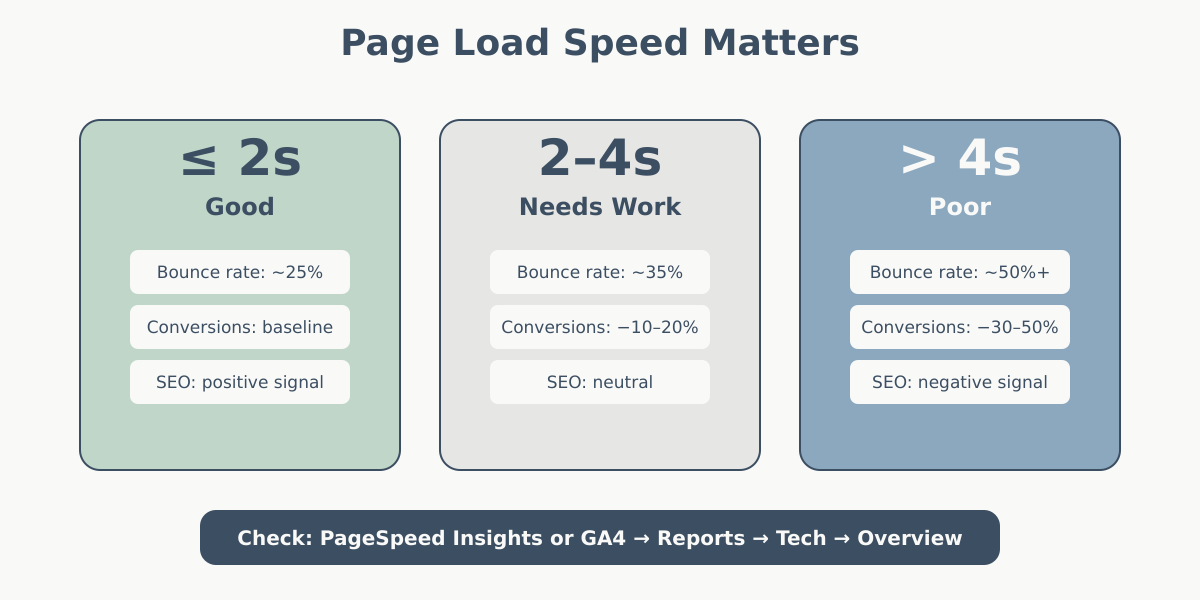
5. Page Load Time (Core Web Vitals)
What it is: A set of metrics that measure how fast and responsive your pages are. The three Core Web Vitals are:
- LCP (Largest Contentful Paint): How long it takes for the main content to load (should be under 2.5 seconds)
- FID (First Input Delay): How quickly the page responds to user interactions (should be under 100ms)
- CLS (Cumulative Layout Shift): How much content jumps around while loading (should be under 0.1)
Why it matters: Speed directly impacts conversions. Studies show that a one-second delay in page load time can reduce conversions by 7%. Google also uses these metrics as a ranking factor, so slow pages hurt your SEO.
Benchmarks:
- LCP: under 2.5 seconds is good; under 1.5 seconds is excellent
- FID: under 100ms is good; under 50ms is excellent
- CLS: under 0.1 is good; 0.05 or less is excellent
Where to find it: GA4 doesn’t show Core Web Vitals by default. Check Google Search Console → Experience → Core Web Vitals for site-wide data, or use PageSpeed Insights for individual page testing. You can also enable “web-vitals” events in GA4 with custom code.
6. Exit Rate by Page
What it is: The percentage of sessions that ended on a specific page. Calculated as (exits from page ÷ total pageviews for that page) × 100.
Why it matters: Exit rate helps you identify where users drop off. A high exit rate on a blog post is normal (people read and leave). A high exit rate on a checkout page signals a problem.
This is different from bounce rate vs engagement rate, which measures single-page sessions.
Benchmarks:
- Blog posts and content: 70-90% exit rate is normal
- Product pages: 40-60% (depends on catalog size)
- Checkout/cart pages: 20-40% (lower is better)
- Confirmation pages: 90%+ (expected — user completed the goal)
Where to find it in GA4: Reports → Engagement → Pages and screens, then add the “Exit rate” metric. Sort by exit rate to find your highest-exit pages, then filter by page type to add context.
7. Customer Acquisition Cost (CAC)
What it is: The total cost to acquire one new customer. Calculated as (total marketing spend ÷ number of new customers acquired).
Why it matters: CAC tells you if your marketing is profitable. If you spend $50 to acquire a customer who generates $40 in revenue, you’re losing money. This metric is especially critical for paid advertising campaigns.
Benchmarks:
- E-commerce (low ticket): $10-50 CAC
- E-commerce (high ticket): $100-500 CAC
- SaaS (B2B): $200-1,000+ CAC (depends on contract value)
- Lead gen services: $50-200 CAC
The key is that your customer lifetime value (LTV) should be at least 3x your CAC. If LTV is $300, your CAC should be under $100.
Where to find it: GA4 doesn’t calculate CAC automatically. You’ll need to combine data:
- Get total marketing spend from your ad platforms or accounting system
- Get new customer count from GA4 (Reports → Acquisition → User acquisition, filtered by “new users” who converted)
- Divide spend by customers
For better tracking, integrate GA4 with Google Ads and connect your CRM to attribute revenue to specific campaigns.
8. Return Visitor Rate
What it is: The percentage of your traffic that comes from people who have visited before. Calculated as (returning users ÷ total users) × 100.
Why it matters: Return visitors indicate brand loyalty, content quality, and whether your site is worth coming back to. A healthy return visitor rate means you’re building an audience, not just renting attention.
Benchmarks:
- News and media sites: 30-50% returning visitors
- Blogs and content sites: 20-40%
- E-commerce: 25-45% (depends on purchase frequency)
- SaaS product dashboards: 60-80% (logged-in users)
Where to find it in GA4: Reports → Acquisition → User acquisition. You’ll see a breakdown of “New users” vs. “Returning users.” Divide returning users by total users to get the percentage.
A site with 90% new visitors every month isn’t building an audience — it’s constantly starting from zero.
9. Goal Completion Rate by Funnel Step
What it is: The percentage of users who complete each step in a conversion funnel. For example, in an e-commerce funnel: view product → add to cart → begin checkout → complete purchase.
Why it matters: This metric pinpoints exactly where users drop off. If 80% of users who add items to their cart never reach checkout, you know where to focus your optimization efforts.
Benchmarks:
- E-commerce cart-to-checkout: 60-70% is typical
- Checkout-to-purchase: 40-60% (anything lower suggests friction)
- Lead gen form starts-to-submissions: 50-70%
- SaaS trial signup multi-step forms: 60-80% per step
Where to find it in GA4: Explore → Funnel exploration. You’ll need to set up a custom funnel with your key events (e.g., “view_item,” “add_to_cart,” “begin_checkout,” “purchase”). GA4 will show you the drop-off rate between each step.
If you haven’t set up event tracking yet, check out our guide on how to set up goals and conversions in GA4.
10. Revenue per Session (for E-commerce)
What it is: The average revenue generated per session on your site. Calculated as (total revenue ÷ total sessions).
Why it matters: This metric combines traffic quality, conversion rate, and average order value into one number. It tells you how much each visit to your site is worth, which is critical for evaluating marketing ROI.
Benchmarks:
- E-commerce (low-ticket items): $1-5 per session
- E-commerce (mid-ticket): $5-15 per session
- E-commerce (high-ticket): $20-100+ per session
Higher revenue per session means you can afford higher customer acquisition costs and still stay profitable.
Where to find it in GA4: Reports → Monetization → Ecommerce purchases. Look for “Average purchase revenue per session.” This requires that you have e-commerce tracking enabled via the GA4 e-commerce events (like “purchase” with revenue parameters).
If you’re not tracking e-commerce yet, follow Google’s guide to implement the enhanced e-commerce events.
How These Metrics Work Together
No single metric tells the whole story. The real insights come from combining metrics to understand what’s happening on your site.
Here are common metric combinations and what they reveal:
| Metric Combination | What It Reveals | Action to Take |
|---|---|---|
| High traffic + low conversion rate | You’re attracting the wrong audience or your offer isn’t compelling | Review traffic sources; improve targeting or refine messaging |
| High pages per session + low session duration | Users are clicking around but not reading — possible navigation issues | Simplify site structure; improve content relevance |
| High conversion rate + low return visitor rate | Good at converting new users but not building loyalty | Add email capture, create content for repeat visits |
| Low exit rate on product pages + high exit rate on checkout | Products are interesting but checkout process has friction | Audit checkout UX, reduce form fields, add trust signals |
| High CAC + low revenue per session | You’re paying too much for low-value traffic | Improve ad targeting or increase average order value |
| Slow page load time + high exit rate | Speed issues are driving users away | Optimize images, reduce scripts, improve hosting |
Use these patterns to guide your analysis. When one metric looks off, check related metrics to understand why.
Setting Up Tracking for These Metrics
Most of these metrics are available in GA4 by default, but a few require setup. Here’s a quick checklist:
Basic GA4 Setup
- Install the GA4 tracking code on every page (or use Google Tag Manager for easier management)
- Verify data is flowing: check the Realtime report after installation
- Configure your data retention settings (default is 2 months; extend to 14 months if possible)
Conversion Tracking
- Mark your key events as conversions in GA4 → Admin → Events → toggle “Mark as conversion”
- Common conversions: “purchase,” “generate_lead,” “sign_up,” “contact,” “download”
- If your conversion event doesn’t exist, create it via Google Tag Manager or GA4’s event creation tool
E-commerce Tracking
- Implement GA4 e-commerce events: “view_item,” “add_to_cart,” “begin_checkout,” “purchase”
- Include revenue and product data in the “purchase” event parameters
- Test your implementation with GA4’s DebugView
Custom Dashboards
- Create a custom dashboard in GA4 with your 10 key metrics for quick access
- Alternatively, use Looker Studio (formerly Google Data Studio) to build a more flexible dashboard
- Set up weekly or monthly email reports to track trends automatically
For a step-by-step walkthrough, see our guide on how to install and set up Google Analytics 4.
Common Mistakes When Tracking Website Metrics
1. Tracking Too Many Metrics
Some website owners try to monitor 30+ metrics every week. This leads to analysis paralysis — you spend all your time looking at data and no time acting on it. Stick to the 10 metrics in this guide (or fewer if some aren’t relevant to your business).
2. Ignoring Context
A 50% exit rate isn’t inherently good or bad — it depends on the page. Always ask: “What should this number be for this page type?” before panicking or celebrating.
3. Not Segmenting Data
Looking at site-wide averages hides important patterns. Segment your data by traffic source, device type, or user type to uncover insights. For example, mobile conversion rates are often 30-50% lower than desktop — if you only look at the average, you’ll miss that.
4. Comparing Different Time Periods Without Accounting for Seasonality
Comparing December’s e-commerce revenue to January’s will always make January look bad. Use year-over-year comparisons instead, or compare to the same week last year.
5. Obsessing Over Small Changes
A 2% week-over-week fluctuation in conversion rate is usually just noise, not a trend. Look for consistent patterns over at least 4-6 weeks before making major decisions.
6. Not Validating Your Data
GA4 tracking breaks more often than you’d think. Regularly check that your key events are firing, revenue numbers match your actual sales, and filters aren’t excluding real traffic.
Creating Your Custom Metrics Dashboard
Option 1: GA4 Built-In Dashboard
- Go to Explore → Create a new blank exploration
- Add your key metrics as variables (conversions, sessions, revenue, etc.)
- Choose a simple table or line chart visualization
- Add a date range comparison (e.g., this month vs. last month)
- Save it and pin it to your dashboard
Option 2: Looker Studio (Recommended for Flexibility)
- Go to Looker Studio and create a new report
- Connect your GA4 property as a data source
- Add scorecards for your 10 key metrics
- Add line charts to visualize trends over time
- Add filters for date range, traffic source, or device type
- Share the dashboard link with your team or schedule automated email reports
Prioritize by Business Model
Not all 10 metrics are equally important for every business. Focus on what matters most:
- E-commerce: Conversion rate, revenue per session, CAC, funnel completion, page load time
- Lead generation: Conversion rate, traffic by source, CAC, return visitor rate, exit rate by page
- Content/media: Pages per session, session duration, return visitor rate, traffic by source, exit rate
- SaaS: Conversion rate (trial signups), CAC, return visitor rate, funnel completion, traffic by source
What to Do With This Data
Tracking metrics is pointless if you don’t act on them. Here’s a simple framework for turning data into decisions:
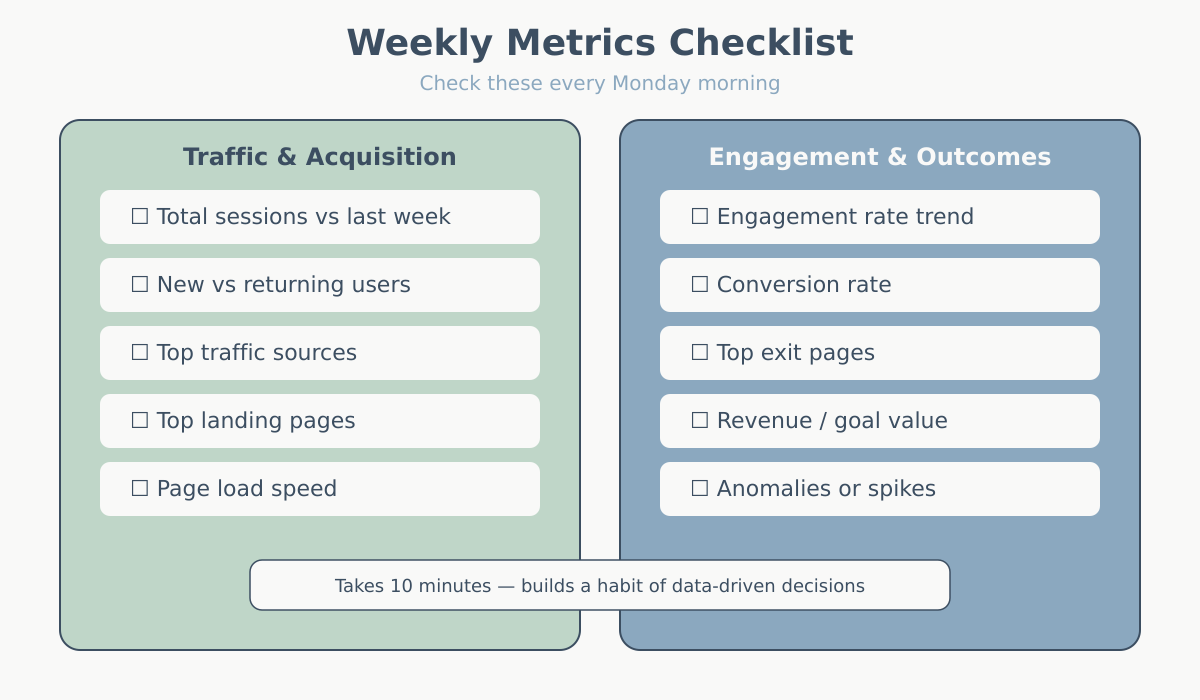
Weekly Review (15 minutes)
- Check your dashboard for any major changes (>20% shifts)
- Identify one metric that’s trending in the wrong direction
- Note any external factors (campaigns launched, site changes, holidays)
Monthly Deep Dive (1-2 hours)
- Review all 10 metrics and compare to the previous month
- Segment data by traffic source, device, or landing page
- Identify the biggest opportunity (e.g., “Organic traffic is up but conversion rate is down — we need better landing pages”)
- Create one action item to address the opportunity
Quarterly Planning (Half day)
- Look at trends over the past 3-6 months
- Evaluate whether your metrics are moving toward your business goals
- Adjust your strategy based on what’s working and what isn’t
- Set specific targets for the next quarter (e.g., “Increase conversion rate from 2.5% to 3.2%”)
Set Up Alerts for Critical Metrics
In GA4, you can create custom alerts to notify you when something breaks or spikes unexpectedly:
- Conversion rate drops more than 25%
- Traffic from a major source drops to zero (tracking might be broken)
- Page load time exceeds 5 seconds
This way, you don’t have to check your dashboard obsessively — you’ll know immediately if something needs attention.
Final Thoughts
These 10 website metrics cover the essentials: how people find you, what they do on your site, and whether they convert. Together, they give you a complete picture of your website’s performance without drowning in data.
Start by making sure you can track all 10 metrics in GA4. Then build a simple dashboard and commit to reviewing it weekly. Over time, you’ll start to see patterns, spot opportunities, and make better decisions.
The goal isn’t to track everything — it’s to track what matters and act on it.