Understanding Attribution Models in Web Analytics
If you run marketing across multiple channels — search ads, social media, email, content — you have probably asked: which channel actually drove that sale? The answer depends entirely on which attribution model you use.
An attribution model is a set of rules that determines how credit for conversions gets distributed across the touchpoints in a customer’s journey. Different models give different answers, and those answers directly affect where you spend your marketing budget.
This guide explains the six core attribution models, shows you how they work with real examples, and helps you choose the right one for your business. If you are still getting oriented with web analytics fundamentals, start there — attribution builds on those basics.
Why Attribution Models Matter
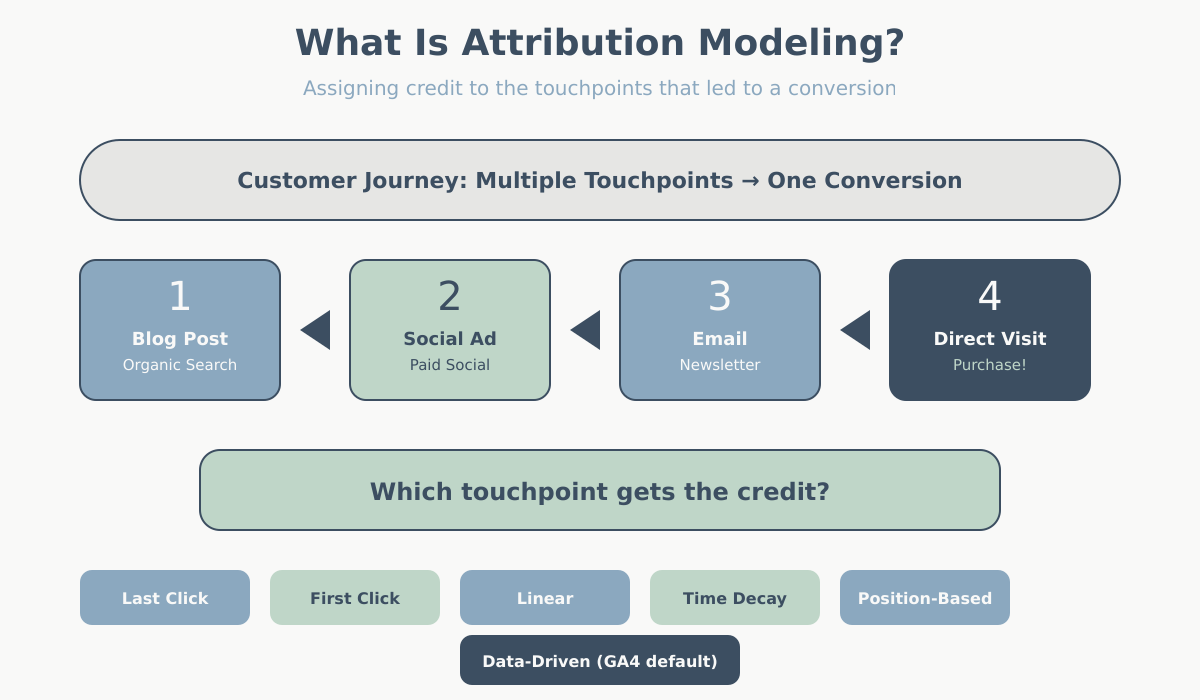
Imagine a customer who first finds your brand through a blog post via organic search, then sees a social media ad a week later, clicks an email newsletter the next day, and finally types your URL directly into their browser and makes a purchase.
Four touchpoints. One conversion. Who gets the credit?
If you use last click attribution, the direct visit gets 100% of the credit. Your blog, social ad, and email campaign appear to have contributed nothing. Based on that data, you might cut your content budget. But without that blog post, the customer would never have discovered you in the first place. Now the story changes entirely.
Neither model is lying. They are just answering different questions. Last click asks “who closed the deal?” First click asks “who started the relationship?” The model you pick determines the question you are answering, and by extension, which channels look like heroes and which look like dead weight.
Understanding the key website metrics you track is essential here — attribution decides which metrics get credited to which source.
The Six Core Attribution Models Explained
There are six attribution models that form the foundation of how marketing credit gets allocated. The first five are rule-based — they follow fixed formulas. The sixth, data-driven, uses machine learning. Let’s walk through each one.
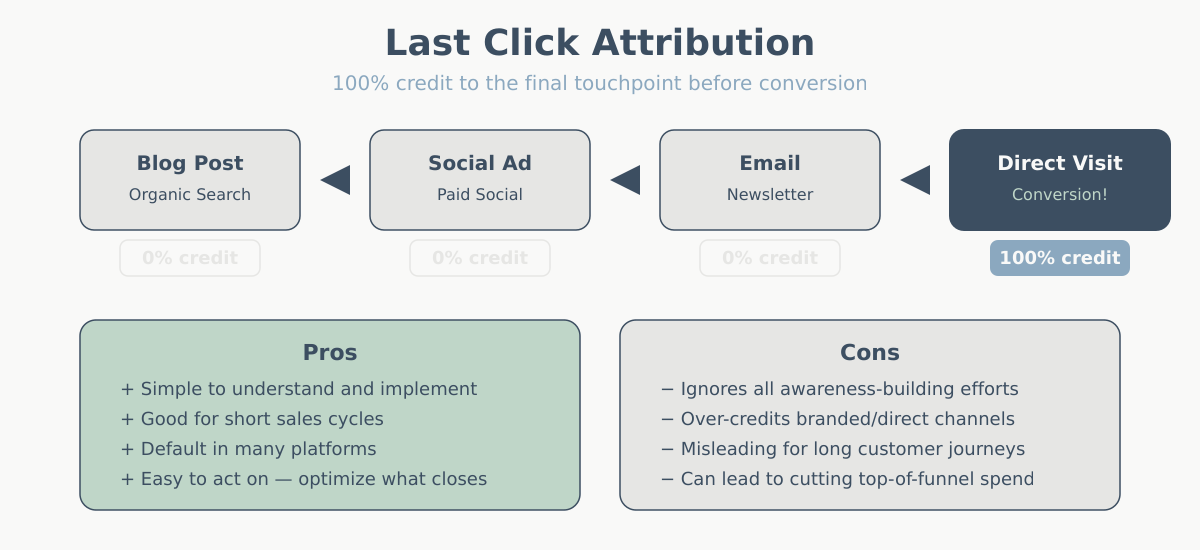
Last Click Attribution
How it works: 100% of the conversion credit goes to the last touchpoint before the conversion.
Example: A user discovers your site through an Instagram ad, later clicks a Google search result, then opens an email, and finally clicks a retargeting ad and buys. The retargeting ad gets all the credit.
When it’s useful: If your sales cycle is short (impulse purchases, low-cost items) and most customers convert in a single session, last click is reasonable. It is also the simplest model to implement and understand.
The catch: Last click systematically overvalues “closing” channels (retargeting, brand search, email) and undervalues “opening” channels (social, display, content marketing). It is like giving all the credit for winning a relay race to the runner who crossed the finish line.
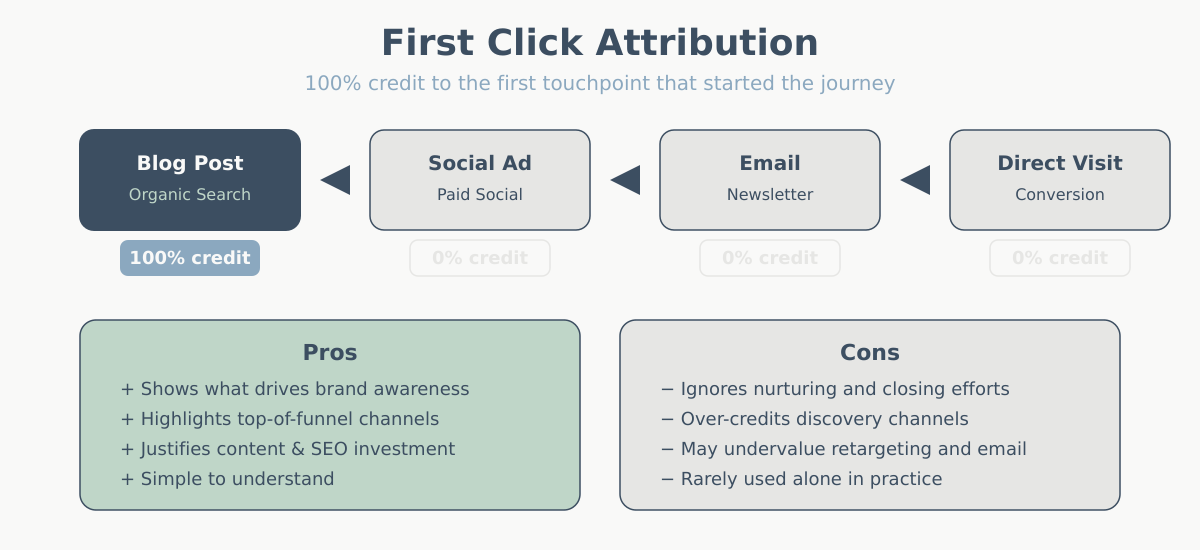
First Click Attribution
How it works: 100% of the conversion credit goes to the first touchpoint that introduced the user to your brand.
Example: Same journey as above — Instagram ad, Google search, email, retargeting ad, purchase. This time, the Instagram ad gets all the credit.
When it’s useful: When you want to understand which channels are best at generating awareness and bringing new audiences into your funnel. Useful for brand-building campaigns and top-of-funnel analysis.
The catch: It ignores everything that happened after discovery. A user might have seen your Instagram ad six months ago and only converted because of a well-timed email last week. First click does not care.
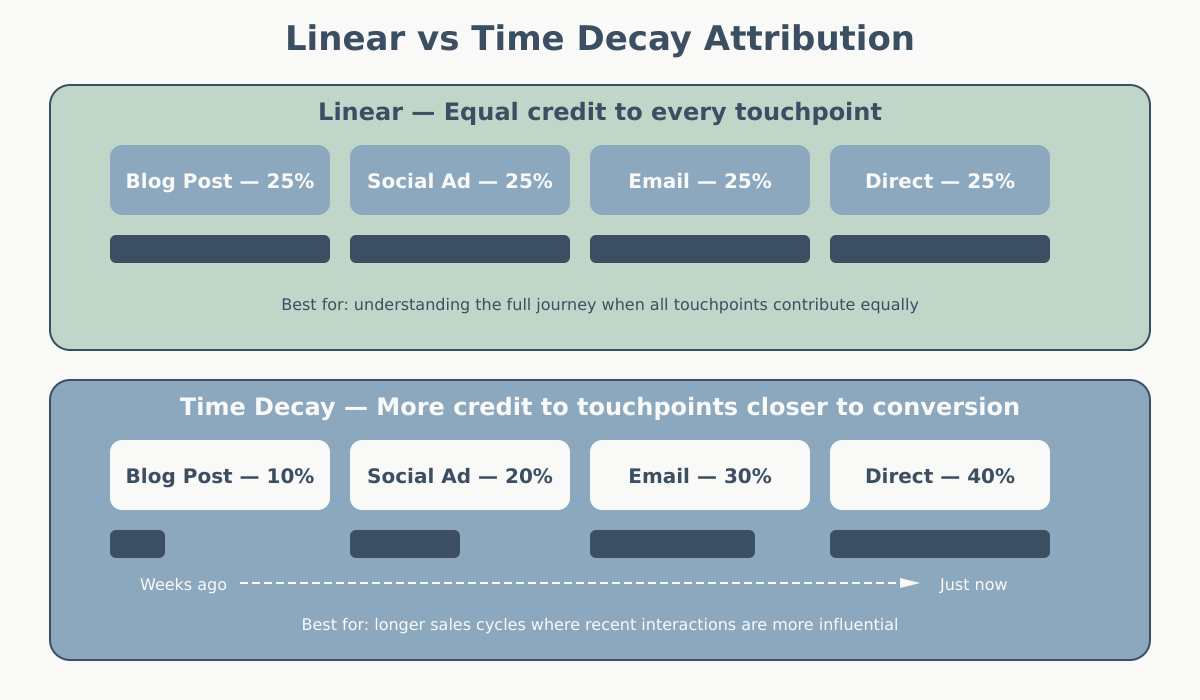
Linear Attribution
How it works: Conversion credit is split equally across every touchpoint in the path.
Example: Instagram ad, Google search, email, retargeting ad, purchase. Each of the four touchpoints gets 25% credit (or 0.25 conversions).
When it’s useful: When you genuinely believe every touchpoint in the journey contributed equally, or when you want a “fair” baseline before diving deeper. It gives you a balanced view without favoring any stage.
The catch: Equal is not the same as accurate. A casual display impression and a decisive email click probably did not contribute equally. Linear is fair but blunt.
Time Decay Attribution
How it works: Touchpoints closer to the conversion get more credit. The further back a touchpoint is in time, the less credit it receives. Credit diminishes based on a half-life — typically 7 days in most implementations.
Example: Instagram ad (14 days ago, ~10% credit), Google search (7 days ago, ~20% credit), email (2 days ago, ~30% credit), retargeting ad (same day, ~40% credit), purchase.
When it’s useful: For longer sales cycles where recency matters. B2B purchases, high-consideration products, or any scenario where the touchpoints right before conversion likely had the strongest influence on the final decision.
The catch: It still undervalues the initial discovery touchpoint. And the “half-life” is usually a fixed assumption, not based on your actual data.
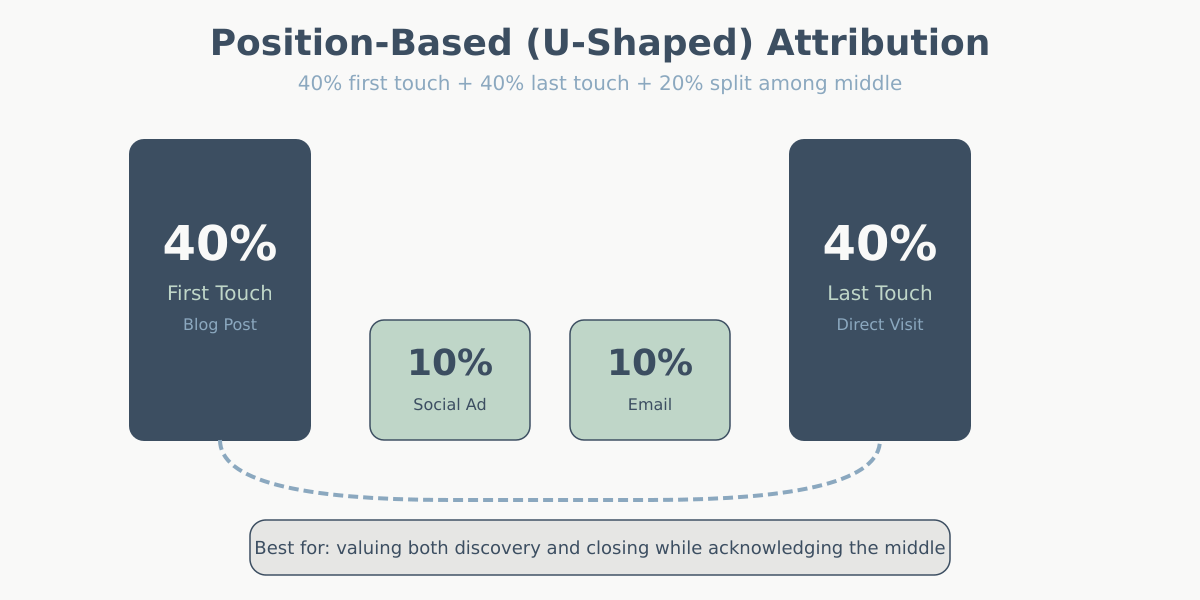
Position-Based (U-Shaped) Attribution
How it works: 40% of the credit goes to the first touchpoint, 40% goes to the last touchpoint, and the remaining 20% is distributed equally among the middle touchpoints.
Example: Instagram ad (40%), Google search (10%), email (10%), retargeting ad (40%), purchase.
When it’s useful: When you believe both the discovery and the closing interactions are the most important, but you still want to give some credit to the nurturing steps in between. This is a popular choice for businesses that invest in both awareness and conversion campaigns.
The catch: The 40/20/40 split is arbitrary. Why not 30/40/30? The model assumes a U-shaped importance curve that may not match your actual customer behavior.
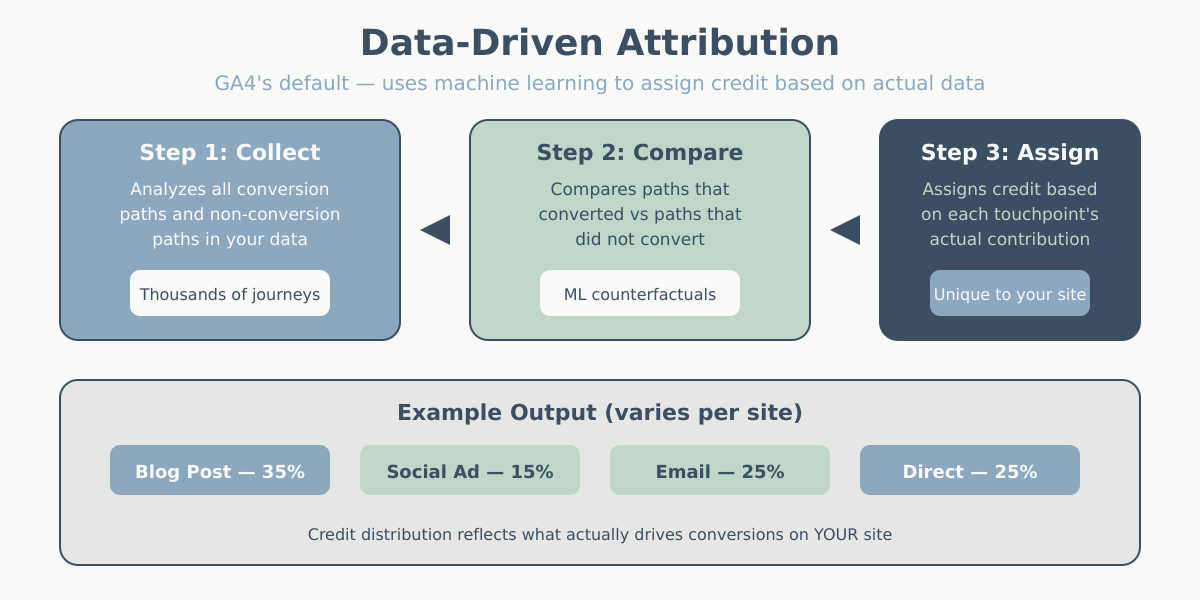
Data-Driven Attribution
How it works: Instead of fixed rules, a machine learning algorithm analyzes your actual conversion paths and calculates the true contribution of each touchpoint. It compares converting paths against non-converting paths to determine which interactions genuinely influenced the outcome.
Example: The algorithm might find that for your business, email touchpoints are unusually powerful closers while social ads contribute more to awareness than the average. Credit allocation adapts to your real data rather than a preset formula.
When it’s useful: When you have enough conversion data (Google recommends a minimum of 300 conversions over 30 days for reliable results) and want the most accurate picture. This is now the default model in Google Analytics 4.
The catch: It is a black box — you cannot easily see why the algorithm assigned credit the way it did. It also requires a meaningful volume of data. If you are a small site with 20 conversions per month, data-driven attribution will not have enough signal to work properly, and GA4 will fall back to a simpler model.
If you have not yet set up conversion tracking, our guide on setting up goals in GA4 walks through the process step by step.
Attribution Models Compared: Side-by-Side Table
Here is a direct comparison of all six models across the dimensions that matter most when choosing one.
| Model | Credit Distribution | Best For | Strengths | Weaknesses | GA4 Availability |
|---|---|---|---|---|---|
| Last Click | 100% to last touchpoint | Short sales cycles, direct response | Simple, easy to understand | Ignores awareness and nurturing channels | Available (reporting only) |
| First Click | 100% to first touchpoint | Brand awareness campaigns | Reveals discovery channels | Ignores closing and nurturing touchpoints | Available (reporting only) |
| Linear | Equal split across all | Balanced baseline analysis | Fair, no bias toward any stage | Treats all touchpoints as equally valuable | Available (reporting only) |
| Time Decay | Increasing credit toward conversion | Long sales cycles, B2B | Values recency, good for considered purchases | Undervalues early touchpoints; fixed half-life | Available (reporting only) |
| Position-Based | 40% first / 20% middle / 40% last | Balanced funnel evaluation | Credits both discovery and closing | Arbitrary split; middle touchpoints undervalued | Available (reporting only) |
| Data-Driven | Algorithmically calculated | Sites with 300+ monthly conversions | Most accurate; adapts to your data | Black box; needs high data volume | Default model for all properties |
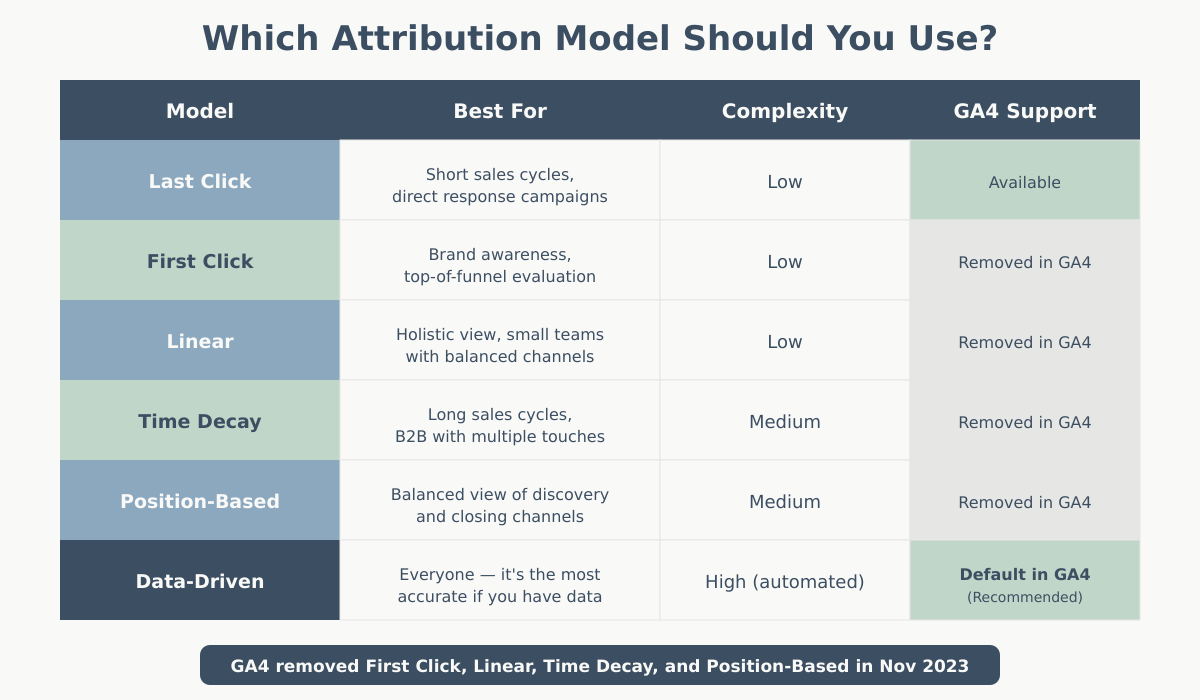
Important GA4 note: As of 2023, Google removed the ability to use rule-based models (first click, linear, time decay, position-based) for attribution in reporting. These models are still available in the Model Comparison tool within the Advertising section, but data-driven attribution is now the only model applied to your standard reports.
A Real-World Customer Journey: Same Data, Six Different Stories
Let’s make this concrete. Here is a realistic customer journey for an online store selling running shoes:
- Day 1 — Facebook Ad: Sarah sees a sponsored post about trail running shoes. She clicks, browses the category page, and leaves.
- Day 4 — Organic Search: She searches “best trail running shoes 2025,” finds a blog post on your site, reads it, and leaves again.
- Day 8 — Email Newsletter: She had subscribed to your newsletter during the blog visit. She opens the weekly email, clicks a link to a shoe she liked, adds it to her cart, but does not buy.
- Day 9 — Retargeting Ad: A Google Display retargeting ad reminds her about the shoes in her cart. She clicks and completes the $120 purchase.
One conversion. Four touchpoints. Here is how each model allocates the $120 in revenue credit:
| Model | Facebook Ad | Organic Search | Retargeting Ad | |
|---|---|---|---|---|
| Last Click | $0 | $0 | $0 | $120 |
| First Click | $120 | $0 | $0 | $0 |
| Linear | $30 | $30 | $30 | $30 |
| Time Decay | $12 | $22 | $38 | $48 |
| Position-Based | $48 | $12 | $12 | $48 |
| Data-Driven | ~$30 | ~$25 | ~$40 | ~$25 |
Data-driven values are illustrative — actual output depends on your site’s conversion path data.
Notice how dramatically the story changes. Under last click, Facebook and organic search appear to contribute nothing. Under first click, retargeting — which actually closed the sale — looks worthless. Under data-driven, the algorithm might find that email was the strongest influence based on patterns across thousands of similar journeys on your site.
This is exactly why attribution model selection is a business decision, not a technical default. Understanding how users engage across sessions ties directly to metrics like bounce rate versus engagement rate in GA4.
How to Choose the Right Attribution Model
There is no universally “correct” attribution model. The right choice depends on your business context. Here is a practical framework:
Start with Your Sales Cycle Length
- Short cycles (same-day or 1-3 days): Last click is often sufficient. Most conversions involve one or two touchpoints, so complex models add noise rather than insight.
- Medium cycles (1-4 weeks): Linear or position-based gives you a more balanced view. Multiple channels typically play meaningful roles.
- Long cycles (1-6 months, B2B): Time decay or data-driven. Many touchpoints over time, and recency or algorithmic weighting better reflects reality.
Consider Your Channel Mix
- Heavy top-of-funnel investment (content, social, display): Avoid last click — it will make your awareness channels look useless. Use first click or position-based to see their true contribution.
- Heavy bottom-of-funnel investment (search ads, retargeting, email): Last click will overinflate these channels. Linear or data-driven provides a counterbalance.
- Balanced mix: Data-driven (if you have the volume) or position-based gives the most useful picture.
Check Your Data Volume
- Fewer than 100 conversions/month: Stick with rule-based models. Data-driven attribution needs volume to produce reliable results.
- 100-300 conversions/month: Data-driven may work but results can be unstable. Compare it against rule-based models to sanity-check.
- 300+ conversions/month: Data-driven is your best option. Let the algorithm do what it does best.
Quick Decision Guide
| Your Situation | Recommended Model | Why |
|---|---|---|
| Small e-commerce, short sales cycle | Last Click | Simple, sufficient for impulse purchases |
| Brand awareness campaign evaluation | First Click | Reveals which channels drive new user discovery |
| Initial baseline analysis | Linear | Fair starting point before refining |
| B2B or high-value products | Time Decay | Accounts for long, multi-touch sales cycles |
| Full-funnel marketing operation | Position-Based | Credits both discovery and conversion stages |
| 300+ conversions/month, GA4 | Data-Driven | Most accurate, adapts to your real data |
Attribution in Google Analytics 4: What Changed
If you use Google Analytics 4 — and our GA4 guide can help you get oriented — you need to understand several important shifts in how attribution works compared to Universal Analytics.
Data-Driven Is Now the Default
GA4 uses data-driven attribution as the default model for all properties. You did not choose it — Google chose it for you. This is a significant philosophical shift: Google believes algorithmic attribution is better than rule-based models for most businesses, and they have made it the standard. See Google’s documentation on data-driven attribution for the full technical details.
For properties without enough conversion data, GA4 automatically falls back to a simplified model that approximates data-driven results using cross-account learnings.
Rule-Based Models Were Removed from Reporting
In late 2023, Google removed first click, linear, time decay, and position-based attribution from GA4’s standard reporting attribution. You can no longer select these models in your property’s attribution settings for everyday reports.
However, you can still compare models using the Model Comparison report in GA4’s Advertising section. This lets you see how conversions would be distributed under different rule-based models alongside the data-driven default — useful for understanding how model choice affects your data interpretation.
How to Access Attribution Settings in GA4
- Go to Admin → Attribution Settings (under your property’s Data Display settings).
- Here you can adjust the reporting attribution model (data-driven is the only option for standard reports now) and the lookback window.
- The lookback window determines how far back GA4 looks for touchpoints. The default is 30 days for acquisition conversion events and 90 days for all other conversion events. You can change these to 7, 30, 60, or 90 days depending on your sales cycle.
For a full walkthrough, see Google’s GA4 attribution settings guide.
Attribution Paths and Conversion Paths Reports
GA4 provides dedicated reports under Advertising → Attribution:
- Conversion paths: Shows the actual touchpoint sequences users followed before converting, with credit allocated by the data-driven model. See Google’s documentation on the conversion paths report in GA4 for more detail.
- Model comparison: Compare data-driven attribution against last click to see which channels gain or lose credit under different rules.
These reports are essential for anyone managing multi-channel marketing. They show you the full path to conversion rather than just the last interaction — something that was harder to access in Universal Analytics.
Proper attribution also depends on correct event and conversion tracking. If you have not set up Google Tag Manager yet, do that first — accurate data collection is a prerequisite for meaningful attribution analysis.
Common Attribution Mistakes (and How to Avoid Them)
Mistake 1: Trusting Last Click by Default
Many teams never question the attribution model in their reports. They look at last-click data, see that branded search and retargeting “drive” most conversions, and conclude those are their best channels. Meanwhile, the display and content campaigns that filled the top of the funnel get their budgets cut — and eventually conversions drop because nobody is discovering the brand anymore.
Fix: Always compare at least two models before making budget decisions. Use GA4’s Model Comparison report to see the difference between data-driven and last click attribution for your key conversion events.
Mistake 2: Switching Models Mid-Analysis
Changing your attribution model in the middle of a reporting period, or comparing month-over-month data where one month used last click and the next used data-driven, creates inconsistent data. Trends become unreliable, and performance changes become impossible to attribute to actual marketing changes versus model changes.
Fix: Pick a model and stick with it for a full reporting cycle. If you switch, acknowledge the model change in your analysis and avoid drawing trend conclusions across the switch point.
Mistake 3: Not Having Enough Data for Data-Driven
Data-driven attribution sounds great in theory, but it needs substantial conversion volume to produce reliable results. If your site gets 30 conversions per month, the algorithm does not have enough signal to distinguish meaningful patterns from noise.
Fix: Check your conversion volume. If it is under 300 per month, use a rule-based model (position-based is a good default for multi-channel businesses) and revisit data-driven once your volume grows.
Mistake 4: Ignoring Assisted Conversions
Even within a single model, many analytics tools show both “direct” (last-touch) conversions and “assisted” conversions — interactions that were part of converting paths but did not get last-click credit. Ignoring assisted conversions means you miss half the picture.
Fix: Review the assisted conversions data in GA4’s conversion paths report. A channel with few direct conversions but many assists is doing real work — it is just doing it earlier in the journey.
Key Takeaways
- An attribution model is a rule set that determines how conversion credit is distributed across marketing touchpoints. The model you choose directly affects how you evaluate channel performance and allocate budget.
- The six core models are last click, first click, linear, time decay, position-based, and data-driven. Each answers a different question about your marketing funnel.
- No single model is universally correct. Choose based on your sales cycle length, channel mix, and data volume.
- GA4 now defaults to data-driven attribution, which uses machine learning to calculate credit. Rule-based models are still accessible in the Model Comparison report but no longer available in standard reporting.
- Always compare multiple models before making major budget decisions. The difference between models often reveals which channels are being over- or under-credited.
- Attribution is only as good as your tracking setup. Accurate event tracking, proper UTM tagging, and correct conversion configuration are prerequisites for any attribution analysis to be meaningful.