Bounce Rate vs Engagement Rate in GA4: What Changed and What to Track
If you recently switched from Universal Analytics to Google Analytics 4, you probably noticed something strange: your bounce rate looks completely different. Maybe it dropped dramatically. Maybe it disappeared from your reports entirely until you went looking for it.
That is not a bug. GA4 fundamentally changed how it measures whether visitors actually engage with your site. The old bounce rate is gone, replaced by a smarter system built around a new core metric called engagement rate.
This guide breaks down exactly what changed, how the two metrics relate, where to find them in GA4, and which one you should actually focus on.
How Universal Analytics Defined Bounce Rate
In Universal Analytics (UA), bounce rate had a very specific and very strict definition:
A bounce was any session where the user visited only one page and triggered zero interaction events, then left.
That means if someone landed on your blog post, read the entire 3,000-word article over eight minutes, and then closed the tab, UA counted that as a bounce. The session had only one pageview and no tracked interactions, so it was a “single-page session” — a bounce.
This created real problems:
- Content sites and blogs looked like they had terrible engagement, even when readers consumed the content thoroughly.
- Landing pages designed to drive phone calls or off-site actions showed inflated bounce rates because the goal completion happened outside the tracked page.
- Single-page applications (SPAs) often recorded extremely high bounce rates because the UA tracking code saw only one “pageview” even as users navigated through multiple views.
The metric was technically correct by its own definition, but it told a misleading story. A 75% bounce rate on a blog could mean “three out of four visitors left immediately” or “three out of four visitors read everything they needed on one page.” UA could not distinguish between the two.
How GA4 Redefines Bounce Rate
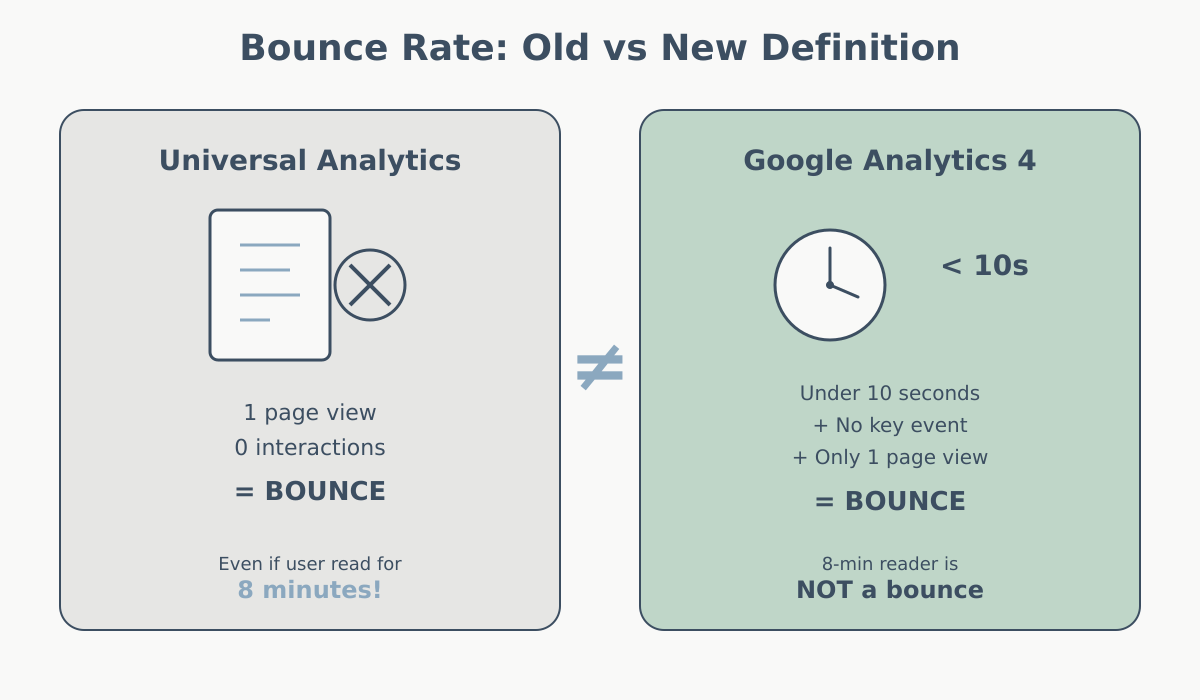
GA4 threw out the old definition entirely. In GA4, bounce rate means something different:
GA4 bounce rate = the percentage of sessions that were not engaged sessions.
So bounce rate in GA4 is simply the inverse of engagement rate. To understand it, you first need to know what GA4 considers an “engaged session.”
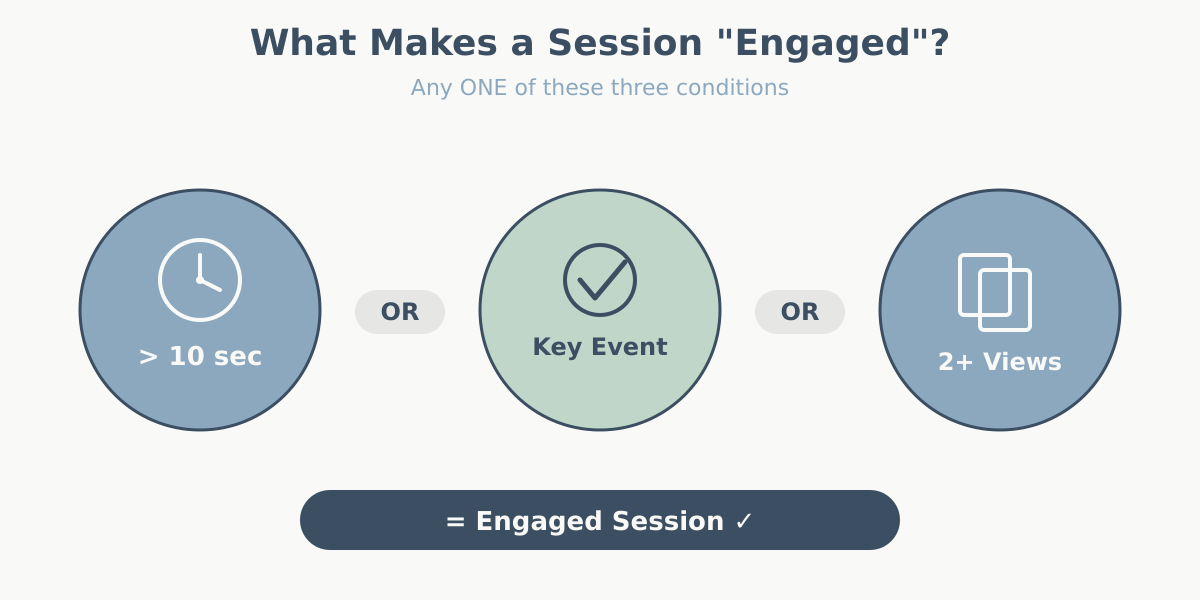
A session counts as engaged if it meets any one of these three conditions:
- The session lasted longer than 10 seconds (this threshold is configurable)
- The session included at least one conversion event (called a “key event” in GA4’s current interface)
- The session included two or more page or screen views
If a session meets none of those conditions, GA4 calls it a bounce.
Here is how the two definitions compare:
| Universal Analytics | GA4 | |
|---|---|---|
| Bounce definition | Single-page session with zero interaction hits | Session that was not engaged (under 10s, no conversion, single page view) |
| A user reads one page for 5 minutes | Bounce | NOT a bounce (session exceeded 10 seconds) |
| A user views one page, converts | Bounce (unless conversion was a tracked interaction) | NOT a bounce (conversion event occurred) |
| A user views one page for 3 seconds and leaves | Bounce | Bounce |
| A user views 2 pages in 6 seconds | NOT a bounce | NOT a bounce (2+ page views) |
The GA4 version is far more realistic. That blog reader who spent eight minutes on a single article? No longer a bounce. The visitor who completed a form submission on a landing page? Not a bounce either, because the form submission counts as a key event.
What Is Engagement Rate in GA4?
Engagement rate is the percentage of sessions that qualified as engaged sessions. GA4 treats this as the primary behavioral metric — it appears prominently in reports, while bounce rate is tucked away and must be added manually in most views.
The formula:
Engagement Rate = (Engaged Sessions / Total Sessions) × 100
A session is engaged if it satisfies at least one of the three conditions mentioned above:
- Duration threshold met: The user’s session lasted longer than 10 seconds (default). GA4 measures this using the time between the
session_startevent and the last event in the session. - Key event triggered: The user completed at least one action you have marked as a key event (conversion) in GA4. This could be a form submission, a purchase, a sign-up — anything you have configured.
- Multiple views: The user viewed at least two pages or screens during the session.
Why does GA4 lead with engagement rate instead of bounce rate? Because it is a positive metric. Rather than measuring failure (“how many visitors did nothing”), it measures success (“how many visitors showed meaningful interest”). This makes it more intuitive to work with and more directly actionable.
When you see an engagement rate of 65%, it tells you that 65 out of every 100 sessions involved a user who either spent real time on your site, completed a goal, or viewed multiple pages. That is a much clearer signal than the old bounce rate.
The Math: How Engagement Rate and Bounce Rate Relate
The relationship is straightforward:
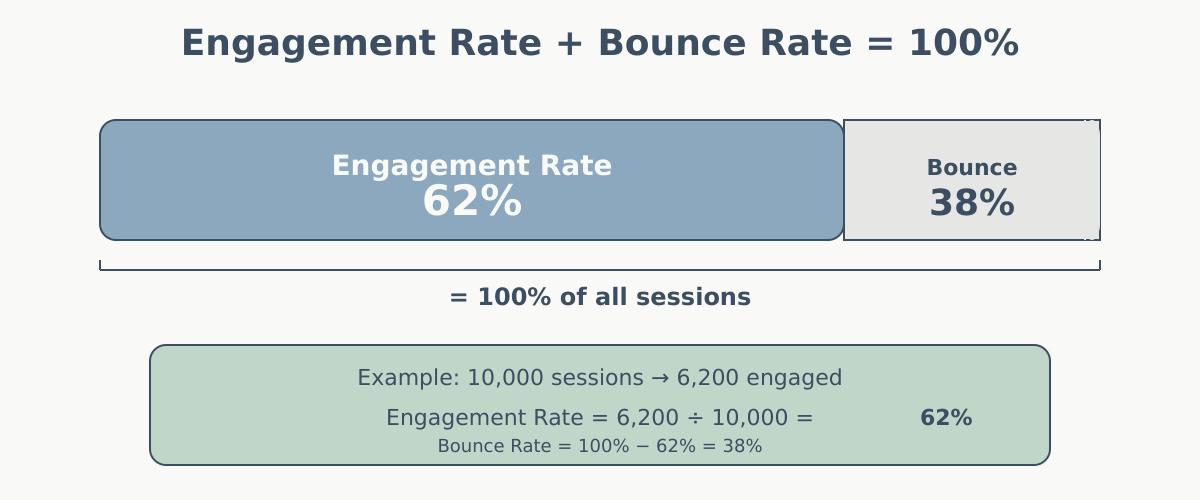
Engagement Rate + Bounce Rate = 100%
If your engagement rate is 62%, your bounce rate is 38%. If your engagement rate is 45%, your bounce rate is 55%. They are two sides of the same coin.
Here is a worked example:
Suppose your site had 10,000 sessions last month. Of those:
- 3,200 sessions lasted longer than 10 seconds (but had only one page view and no conversion)
- 1,500 sessions included two or more page views
- 800 sessions included a key event
- Some sessions met multiple conditions (for example, 600 sessions lasted more than 10 seconds AND had multiple page views)
You do not add the numbers — a session only needs to meet one condition to count as engaged, and meeting multiple conditions does not count it twice. After deduplication, let us say 4,900 unique sessions met at least one engagement condition.
- Engagement rate: 4,900 / 10,000 = 49%
- Bounce rate: (10,000 − 4,900) / 10,000 = 51%
- Check: 49% + 51% = 100%
This means 51% of your sessions involved users who spent under 10 seconds, saw only one page, and did not convert. Those are genuine low-engagement visits.
Where to Find These Metrics in GA4
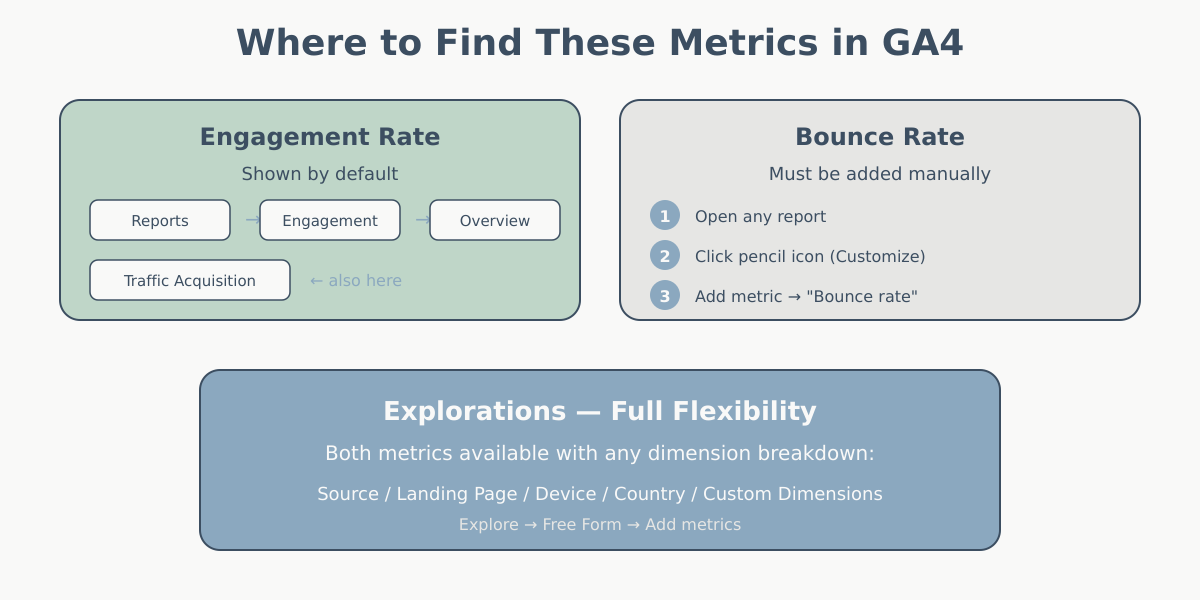
Engagement rate is easier to find than bounce rate in GA4, because Google clearly wants it to be the metric you use. Here is where to look.
In standard reports
- Go to Reports → Engagement → Overview for a high-level engagement summary, including engaged sessions and average engagement time.
- Go to Reports → Engagement → Pages and screens to see engagement metrics broken down by individual pages.
- In the Traffic acquisition report (Reports → Acquisition → Traffic acquisition), engagement rate appears as a default column, letting you compare engagement across channels.
Adding bounce rate to reports
Bounce rate is not shown by default in most GA4 reports. To add it:
- Open any standard report (like Traffic acquisition).
- Click the pencil icon (Customize report) in the upper right.
- Click Metrics in the customization panel.
- Click Add metric and search for “Bounce rate.”
- Add it, reorder if needed, and click Apply, then Save.
In Explorations
If you want full flexibility, use the Explore section in GA4. Create a Free Form exploration and add “Engagement rate” or “Bounce rate” as metrics. You can break these down by any dimension — source/medium, landing page, device category, country, or custom dimensions. Explorations give you the most control over how you analyze engagement data.
In Looker Studio
If you connect GA4 to Looker Studio for custom dashboards, both metrics are available as standard fields. You can drag them into scorecards, tables, or time-series charts without any custom formulas.
What Is a Good Engagement Rate?
This is the question everyone asks, and the honest answer is: it depends heavily on your site type, your content, and your audience.
A news site where readers come from social media, scan a headline, and leave will naturally have a lower engagement rate than an e-commerce site where visitors browse products across multiple pages. Neither is inherently “bad” — they reflect different user behaviors.
That said, here are rough benchmarks to give you a starting point:
| Site Type | Typical Engagement Rate | Notes |
|---|---|---|
| E-commerce | 55–65% | Browsing behavior drives multi-page sessions |
| SaaS / B2B | 50–65% | Visitors researching solutions tend to explore |
| Blog / Content site | 40–55% | Depends on article length and internal linking |
| Landing pages | 35–55% | Single-purpose pages; highly variable by design |
| News / Media | 30–50% | Fast-scan behavior lowers engagement rates |
| Portfolio / Brochure | 30–45% | Small sites with few pages |

Do not treat these numbers as targets. The most valuable comparison is your own engagement rate over time. If your blog’s engagement rate was 42% last quarter and it is 48% this quarter, that is meaningful improvement regardless of where it sits relative to some industry average.
Also consider segmenting. Your overall engagement rate is an average across all traffic sources, devices, and content types. Breaking it down reveals more useful patterns:
- By source: Organic search traffic often has higher engagement than social media traffic.
- By device: Desktop users tend to show higher engagement rates than mobile users on many sites.
- By landing page: Some pages naturally engage more than others. A detailed guide will outperform a thin category page.
- By audience segment: Returning visitors almost always have higher engagement rates than new visitors.
Adjusting the Engaged Session Timer
The default threshold for an engaged session is 10 seconds. GA4 lets you change this to anywhere between 10 seconds and 60 seconds.
How to change it
- In GA4, go to Admin (gear icon at the bottom left).
- Under the Data display column, click Data streams.
- Select your web data stream.
- Click Configure tag settings.
- Look for Adjust session timeout settings. The “Timer for engaged sessions” option lets you change the threshold.
- Choose your preferred duration and save.
When to adjust it
- Increase to 30 seconds if your site has long-form content and you want to distinguish between readers who genuinely engage versus those who just idle with a tab open.
- Increase to 20–30 seconds for SaaS or B2B sites where casual visits are common and you want engagement rate to reflect truly interested visitors.
- Keep at 10 seconds if your site has short pages or fast transactions where 10 seconds of attention is genuinely meaningful.
One caution: if you change the threshold mid-stream, your historical engagement rate data will not retroactively recalculate. You will see a sudden shift in the metric from the date of the change. Document when you made the adjustment so you do not misinterpret the trend later.
Practical Tips for Improving Engagement Rate
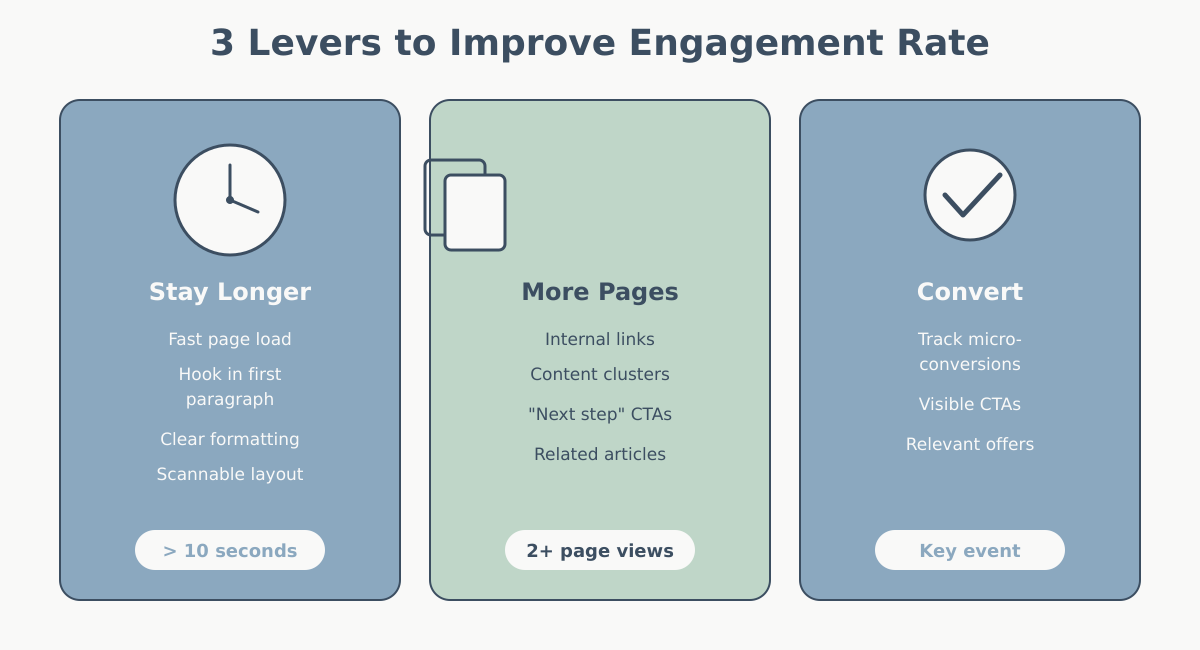
Engagement rate improves when more visitors meet at least one of the three conditions: spending 10+ seconds, viewing multiple pages, or converting. Here are concrete ways to move each lever.
Get visitors to stay longer than the threshold
- Speed up your site. If a page takes 5 seconds to load, users might leave before the 10-second timer even starts meaningfully. A fast-loading page gives the content a chance to work. Use your analytics tool alongside Core Web Vitals data to identify slow pages.
- Hook readers in the first paragraph. Skip long preambles. State what the reader will learn or gain immediately. If someone sees value in the first sentence, they stay.
- Use clear formatting. Subheadings, short paragraphs, bullet lists, and bold key phrases make content scannable. Scannable content keeps people on the page because they can quickly confirm the content is relevant.
Drive multi-page sessions
- Use purposeful internal links. Link to related content where it genuinely helps the reader — not random “you might also like” widgets. For example, if you are discussing setting up conversion tracking, link to the step-by-step guide.
- Create content clusters. When articles naturally connect (like a series on web analytics fundamentals followed by a glossary of key terms), visitors are more likely to read multiple pieces.
- Add “next step” CTAs. At the end of a guide, suggest the logical next action: “Now that you understand engagement rate, learn how to set up key events in GA4.”
Increase conversion events
- Track meaningful micro-conversions. Beyond purchases and form submissions, consider marking events like newsletter sign-ups, PDF downloads, or video plays as key events. Each one can turn a “bounce” into an engaged session.
- Make CTAs visible and relevant. A well-placed call-to-action aligned with the page content converts better than a generic banner. If the page is about choosing an analytics platform, the CTA should relate to trying or comparing tools.
General UX improvements
- Fix mobile usability. Mobile visitors typically show lower engagement. Common culprits include text that is too small, buttons that are too close together, interstitials that block content, and slow load times on cellular connections.
- Reduce distractions. Aggressive pop-ups, auto-playing videos, and cluttered layouts push visitors away before they engage.
Common Mistakes When Comparing Bounce Rate Across Analytics Versions
The most frequent error analysts make during the UA-to-GA4 transition is comparing the old bounce rate to the new one and drawing conclusions from the difference. Here are the pitfalls to avoid.
Mistake 1: Saying “our bounce rate improved” based on GA4 numbers vs. UA numbers
If your UA bounce rate was 70% and your GA4 bounce rate is 45%, that does not mean your site improved. The definitions changed. The GA4 number will almost always be lower because GA4’s definition of a bounce is stricter — many sessions that UA called bounces are now classified as engaged.
Mistake 2: Panicking about a high GA4 bounce rate on a content site
Even with GA4’s more generous definition, content-heavy sites can still show bounce rates of 45–60%. This is not automatically a problem. If readers are arriving, consuming one thorough article in two minutes, and leaving satisfied, that is success — and many of those sessions are counted as engaged in GA4 (because they exceed the 10-second threshold). The remaining bounces are the truly low-engagement visits.
Mistake 3: Ignoring the timer threshold when benchmarking
If you read a case study claiming an 80% engagement rate and your site shows 55%, check whether they adjusted their engaged session timer. A site using the default 10 seconds will show higher engagement rates than one set to 30 seconds, even with identical user behavior.
Mistake 4: Using bounce rate as the sole measure of content quality
Bounce rate (and its inverse, engagement rate) is one behavioral signal among many. A page can have a low bounce rate but still fail to convert. Combine engagement rate with metrics like conversion rate, average engagement time, and scroll depth to get a complete picture.
Bounce Rate vs Exit Rate: A Quick Clarification
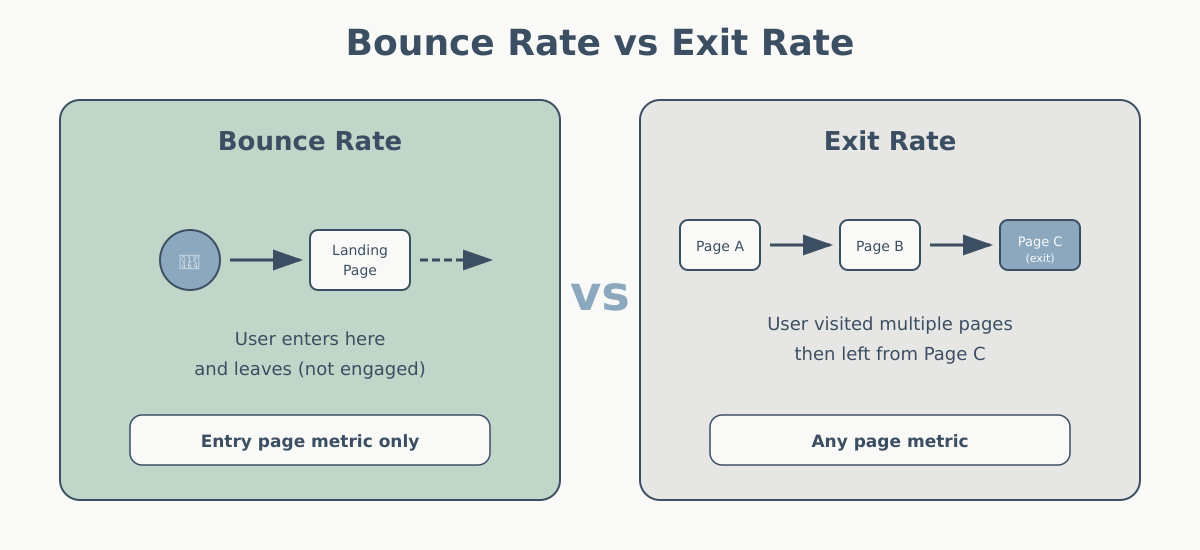
People often confuse bounce rate with exit rate, so here is a quick distinction.
Bounce rate applies only to sessions where a specific page was the entry point (the landing page). It measures how many of those sessions were not engaged.
Exit rate applies to all sessions that included a specific page, regardless of where the user entered. It measures how often that page was the last page viewed before the session ended.
Example: Your pricing page might have a low bounce rate (most visitors who land on it directly explore further) but a high exit rate (many visitors who arrive from other pages leave after viewing pricing). These tell different stories. The low bounce rate means direct traffic to the pricing page is engaged. The high exit rate means visitors who reach the pricing page during their journey tend to end their session there — possibly because they got what they needed, or possibly because something on the page is driving them away.
In GA4, exit rate is not available in standard reports by default but can be calculated in Explorations by dividing exits by total views for each page.
Wrapping Up
The shift from Universal Analytics to GA4 changed bounce rate from a blunt instrument into a more nuanced metric. Here is what matters:
- Engagement rate is GA4’s primary behavioral metric. It measures the percentage of sessions where users spent meaningful time, viewed multiple pages, or completed a key event. Lead with this metric in your reporting.
- Bounce rate in GA4 is simply 100% minus the engagement rate. It still exists, but its definition is entirely different from Universal Analytics, so do not compare the two versions directly.
- The 10-second default threshold is configurable. Adjust it if it does not match the engagement pattern of your specific site type.
- Context beats benchmarks. Your engagement rate trend over time, segmented by source, device, and content type, tells you far more than any industry average. Understanding attribution models helps you evaluate engagement quality by traffic source.
If you are still getting comfortable with GA4, start with the complete beginner’s guide to GA4 and then set up proper goals and key events so your engagement data reflects real business outcomes.