Looker Studio for GA4: Build Your First Report
GA4’s built-in reports are fine for checking numbers, but the moment you need to show those numbers to a client, a boss, or a teammate without GA4 access, they fall short. That’s where Looker Studio comes in: a free Google tool that turns your GA4 data into clean, shareable, genuinely good-looking dashboards. This guide walks you from a blank canvas to your first working GA4 report.
Before you drag a single chart onto the page, know what you’re reporting. A report is only as useful as the key website metrics you choose to show — pick those first, then build around them.
What Looker Studio Is (and Why Use It)
Looker Studio — formerly Google Data Studio — is Google’s free reporting and dashboard tool. It connects directly to GA4 and many other sources.
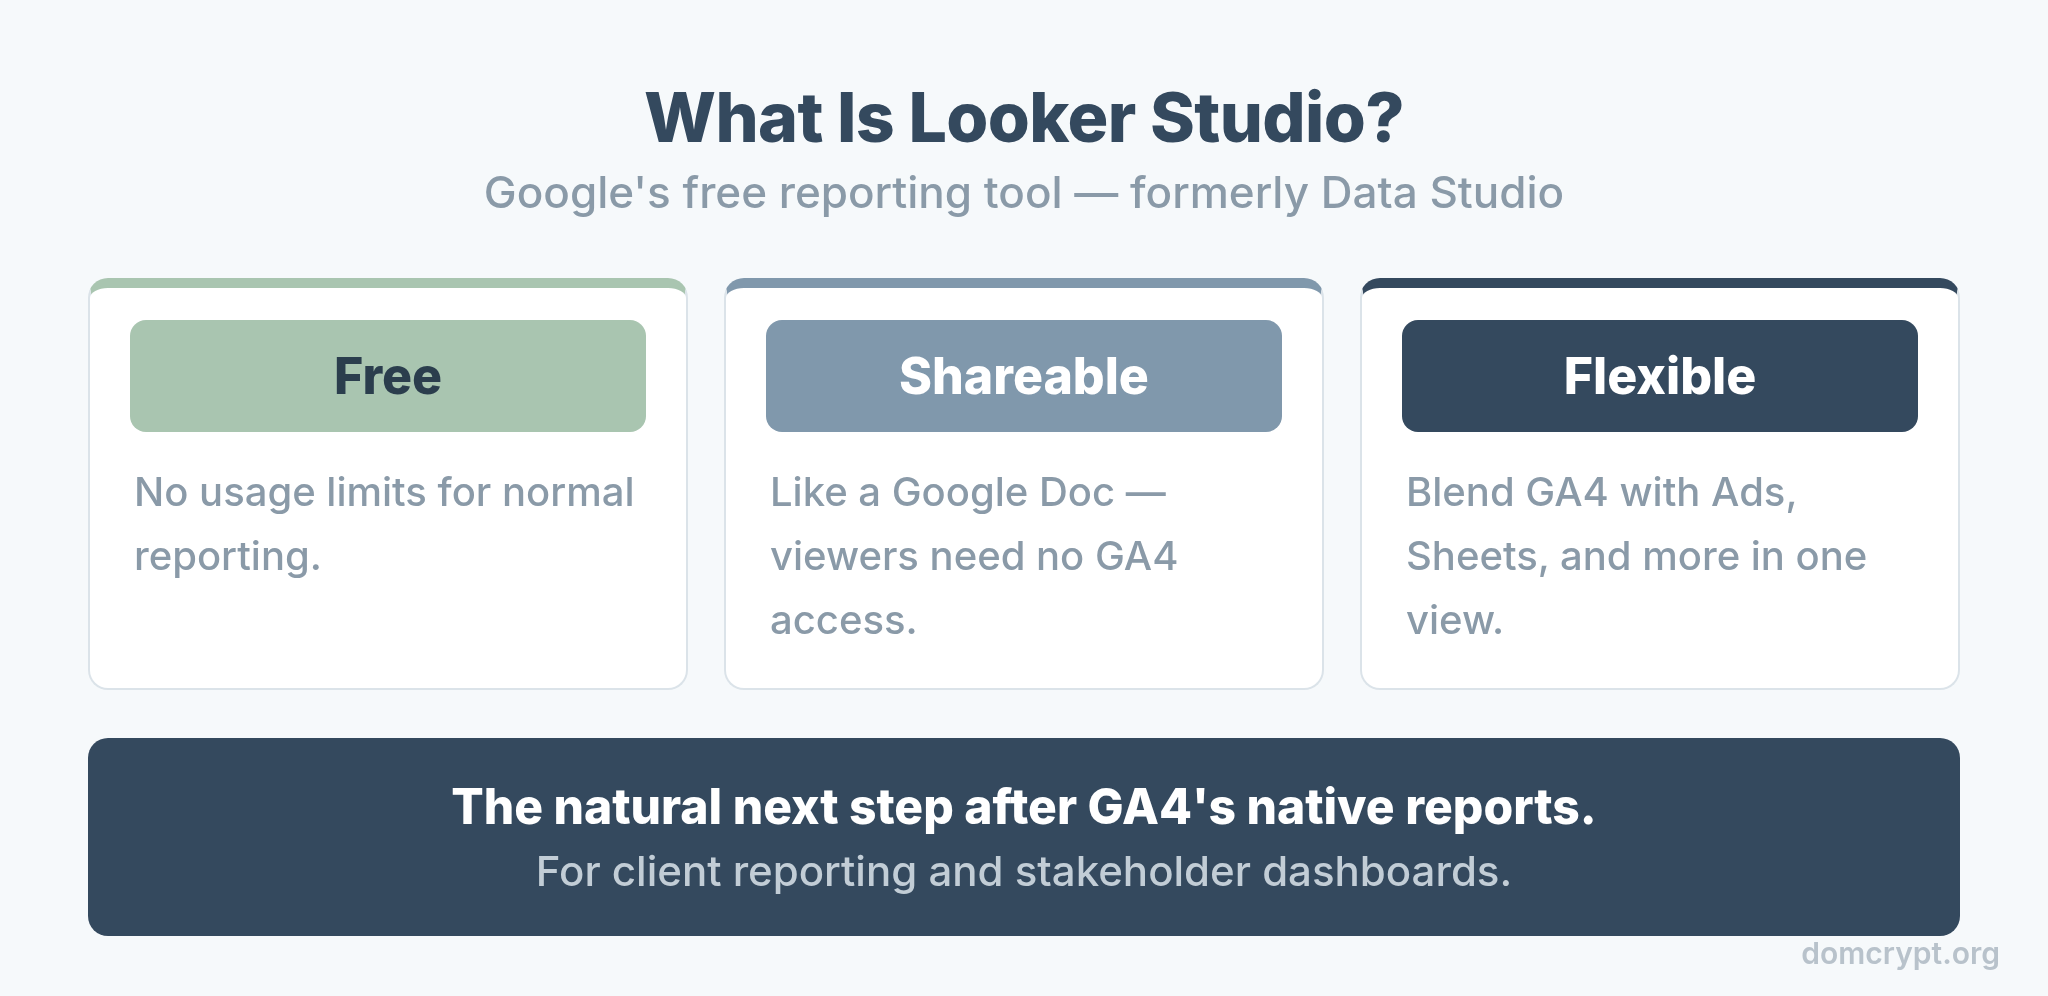
Three things make it worth learning. It’s free, with no usage limits for normal reporting. It’s shareable like a Google Doc, so anyone with a link can view your dashboard without touching GA4. And it’s flexible, letting you blend GA4 with Google Ads, Sheets, and more into one view. For client reporting and stakeholder dashboards, it’s the natural next step after GA4’s native reports.
Looker Studio vs GA4 Native Reports
Looker doesn’t replace GA4 — it complements it. Knowing the dividing line keeps you from overbuilding.
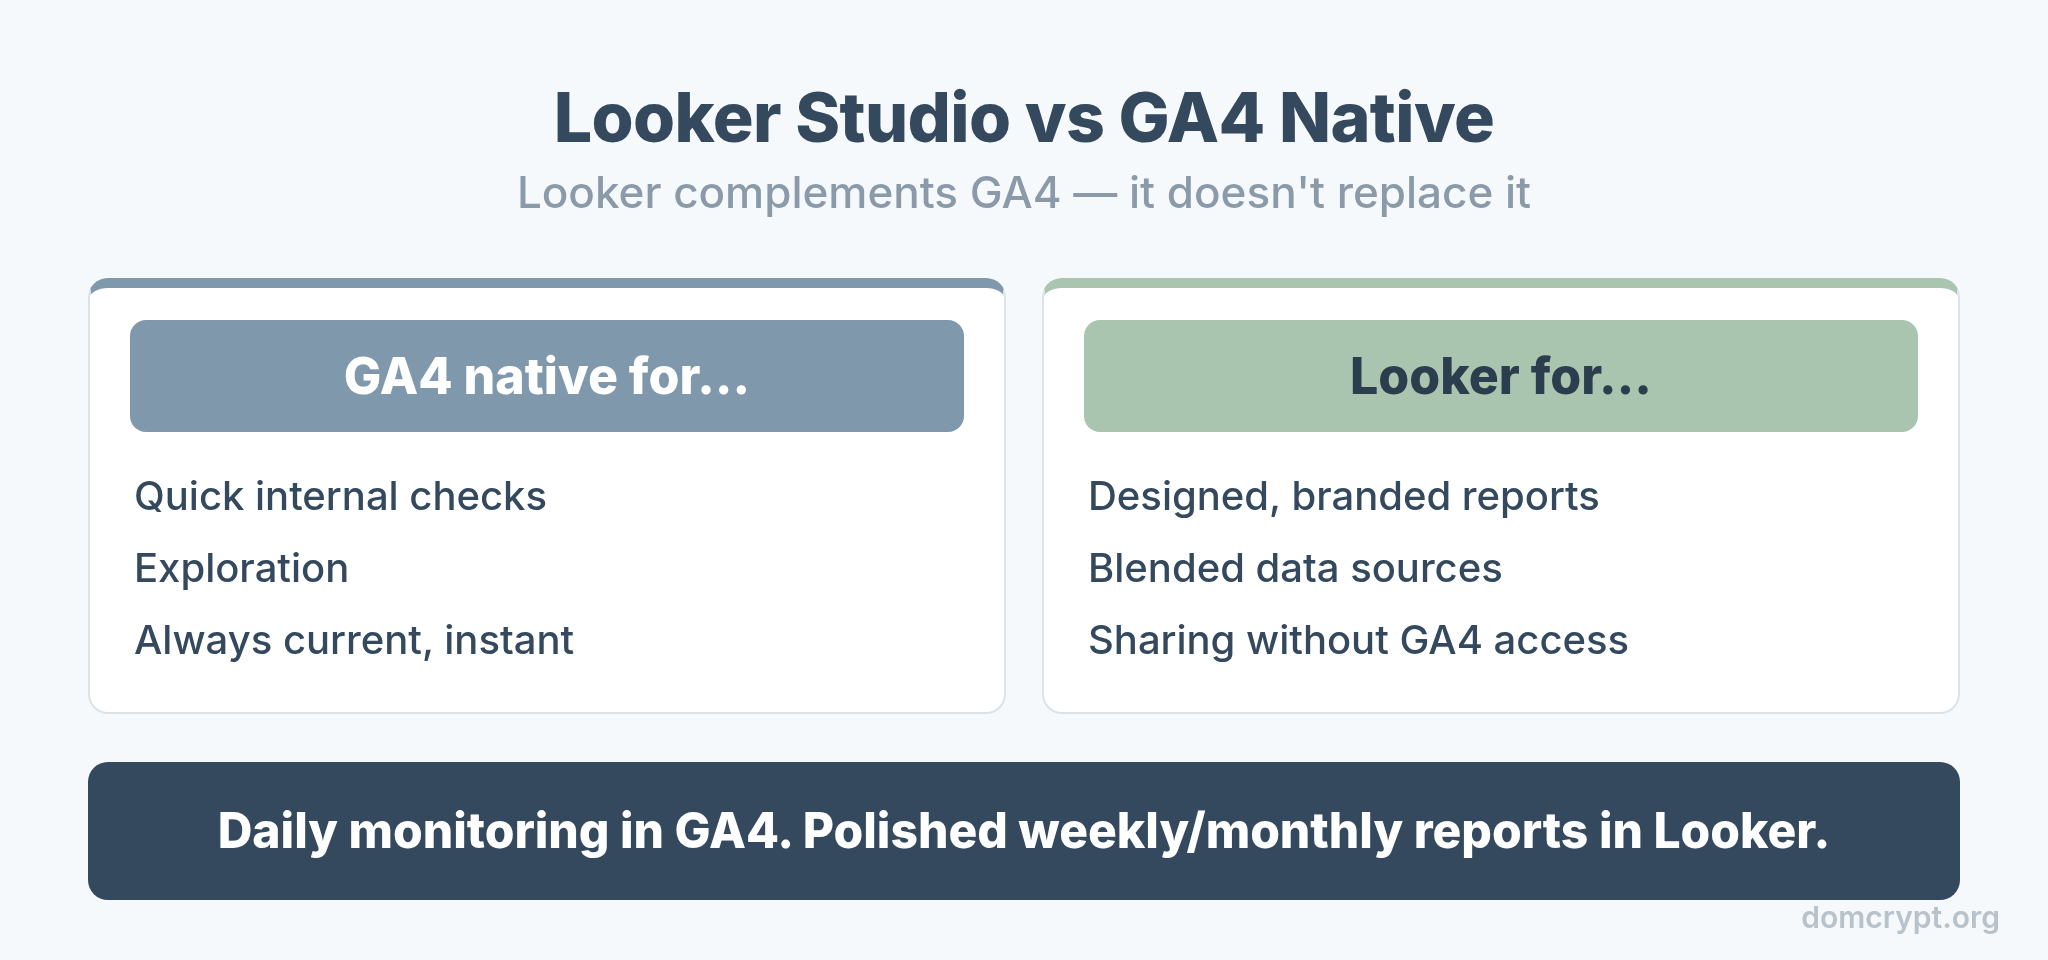
Use GA4 native for quick internal checks and exploration — it’s instant and always current. Use Looker Studio when you need a designed, branded report, want to blend multiple data sources, or have to share with people who don’t use GA4. Most teams keep daily monitoring in GA4 and reserve Looker for the polished weekly or monthly report that goes out to others.
Connect GA4 as a Data Source
Everything in Looker starts with a data source. Connecting GA4 takes about a minute.
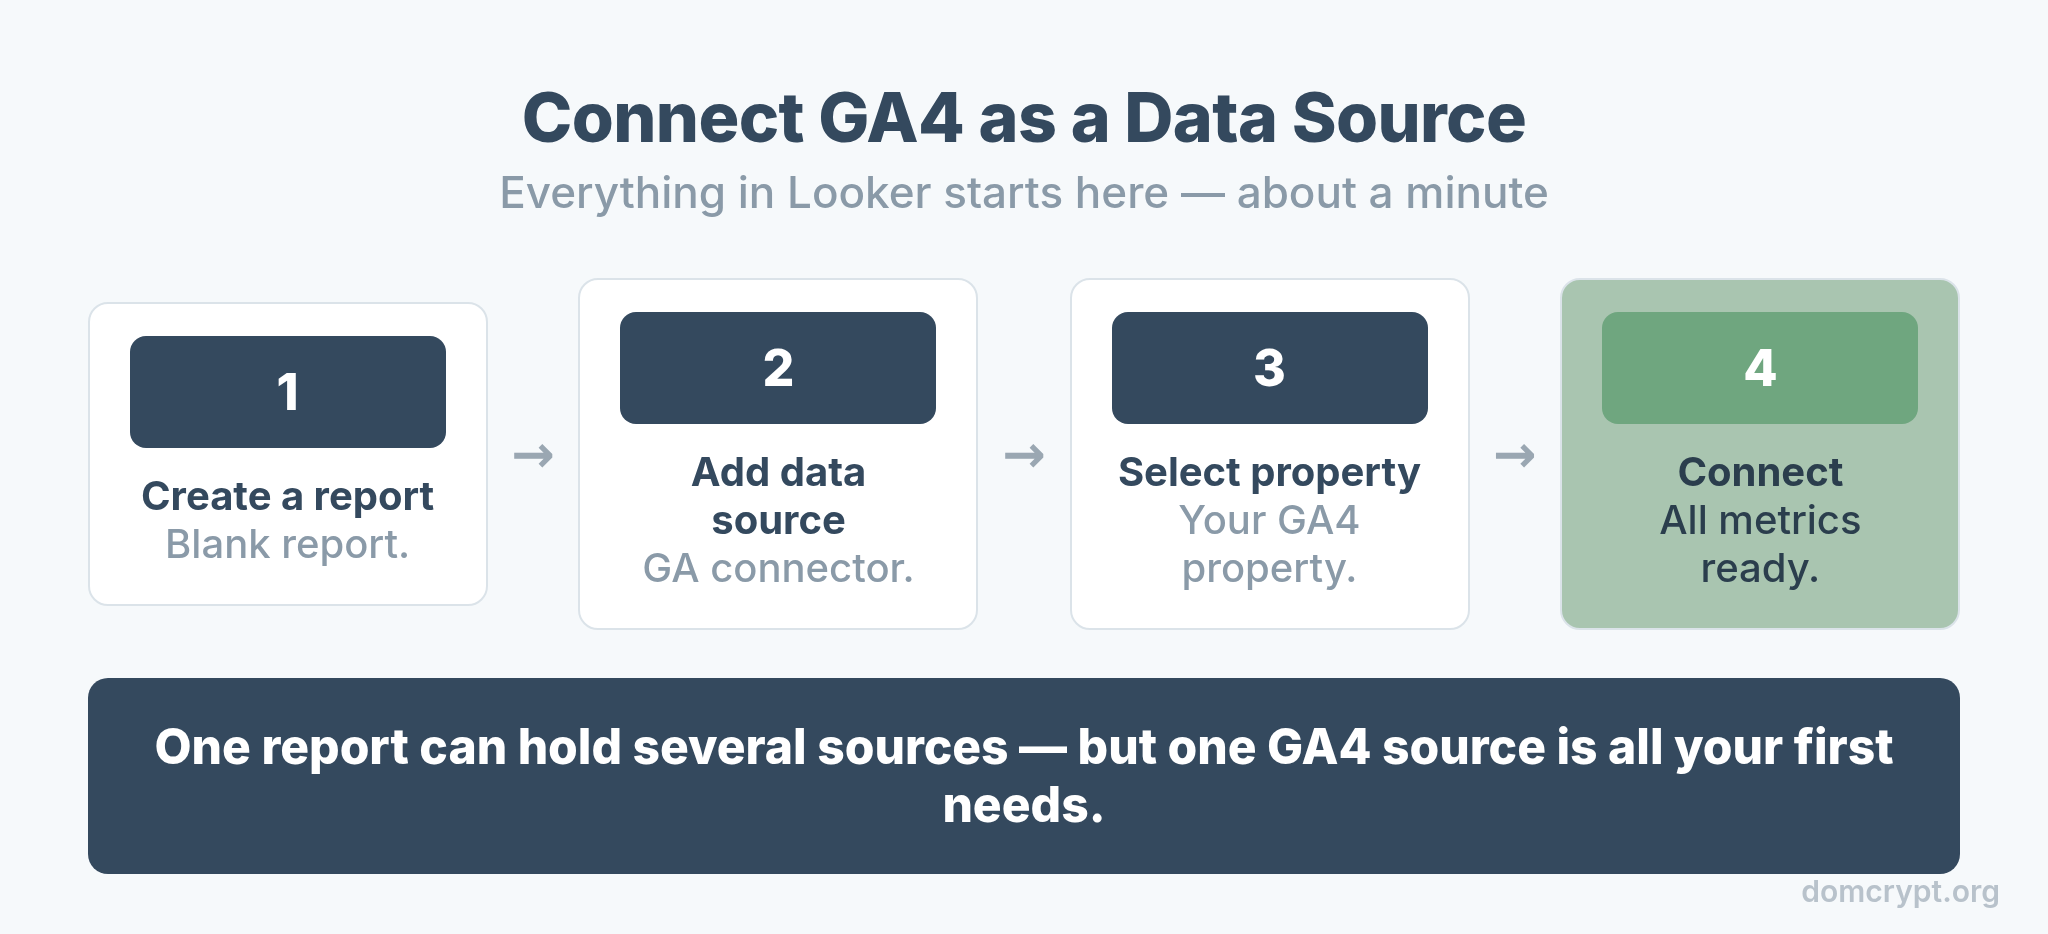
- Create a report. In Looker Studio, click “Create” and choose a blank report.
- Add a data source. Pick the Google Analytics connector.
- Select your property. Choose the GA4 account and property you want to report on.
- Connect. Looker pulls in every GA4 dimension and metric, ready to use.
One report can hold several data sources, which is how you’ll later blend GA4 with Ads or Sheets. But for your first report, one GA4 source is all you need.
The Building Blocks of a Report
Every Looker dashboard is assembled from four kinds of components. Learn these and you can build anything.
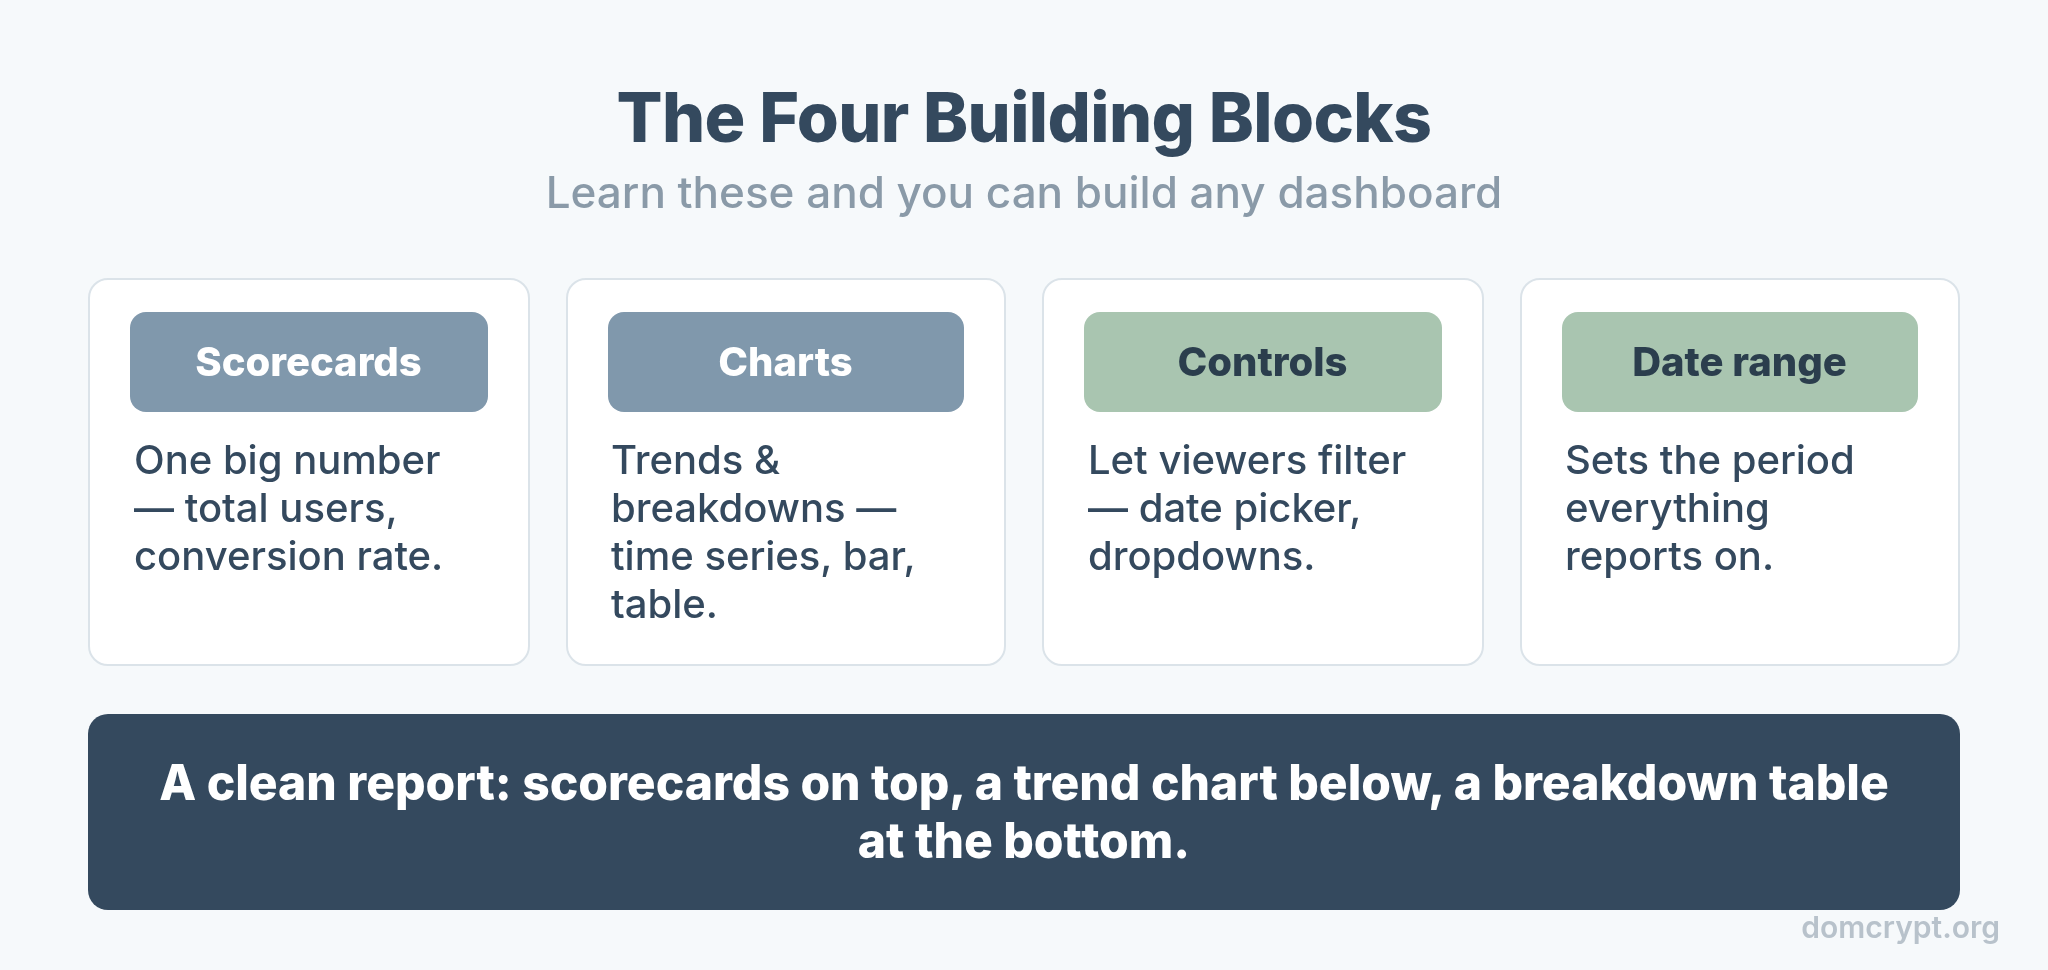
Scorecards show a single big number, like total users or conversion rate. Charts visualize trends and breakdowns — time series, bar, pie, tables. Controls let viewers filter the report themselves, such as a date picker or a channel dropdown. And the date range sets the period everything reports on. A clean report is usually a few scorecards across the top, a trend chart below, and a breakdown table at the bottom.
Build Your First Report
Here’s the fastest path from blank page to a report you’d actually send someone.
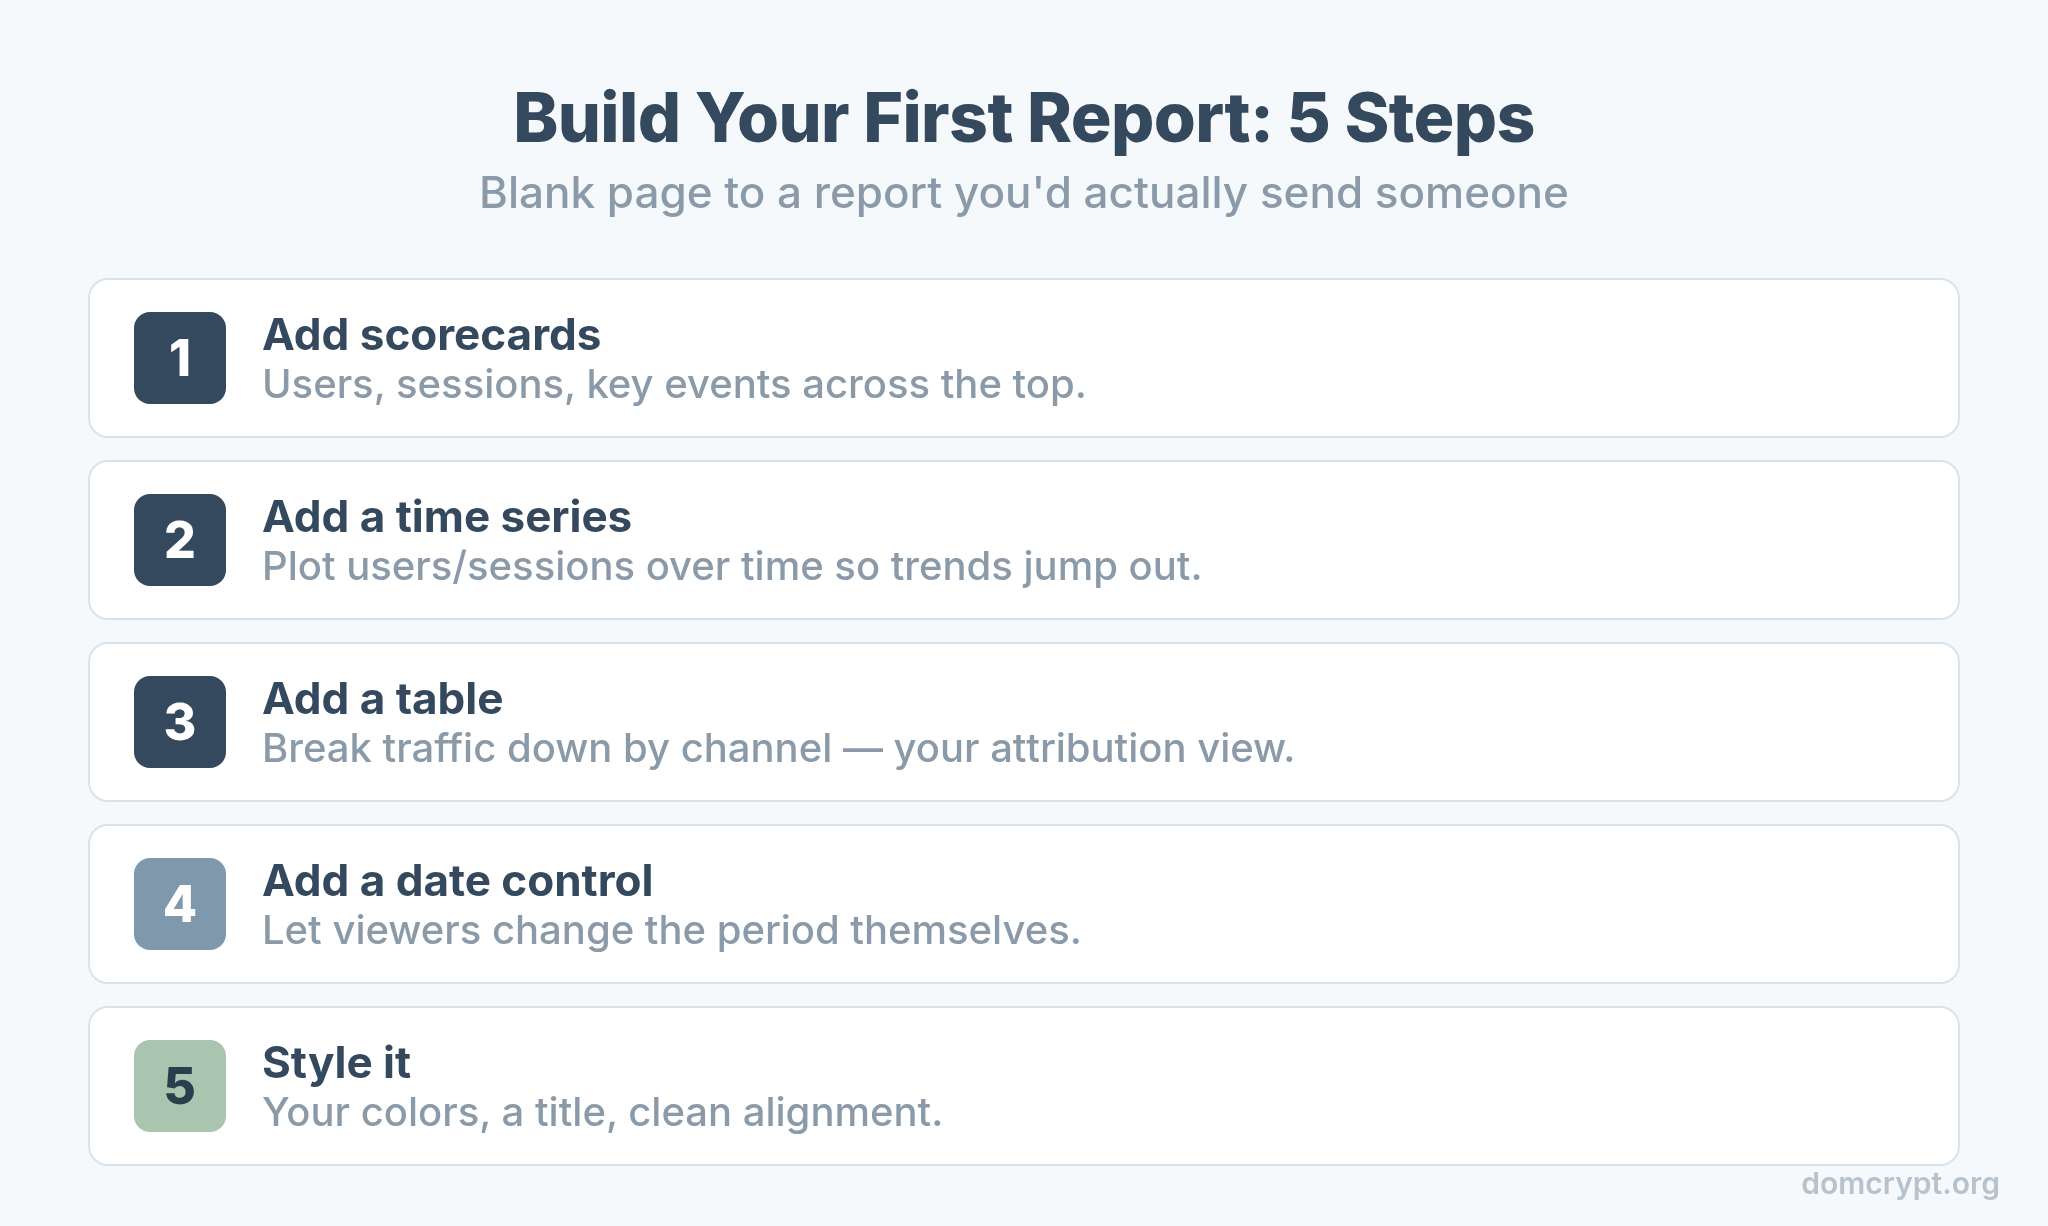
- Add scorecards. Drop in users, sessions, and key events across the top for an instant summary.
- Add a time series. Plot users or sessions over time so trends jump out.
- Add a table. Break traffic down by channel or landing page — your attribution view.
- Add a date control. Let viewers change the period without editing the report.
- Style it. Apply your colors, add a title, and align everything cleanly.
That channel breakdown table is where Looker connects to your bigger picture — it’s a live, shareable version of your attribution model, showing which sources drive the numbers in your scorecards.
Share It, and Avoid These Mistakes
Sharing is Looker’s superpower, but a few common errors trip up first-timers.
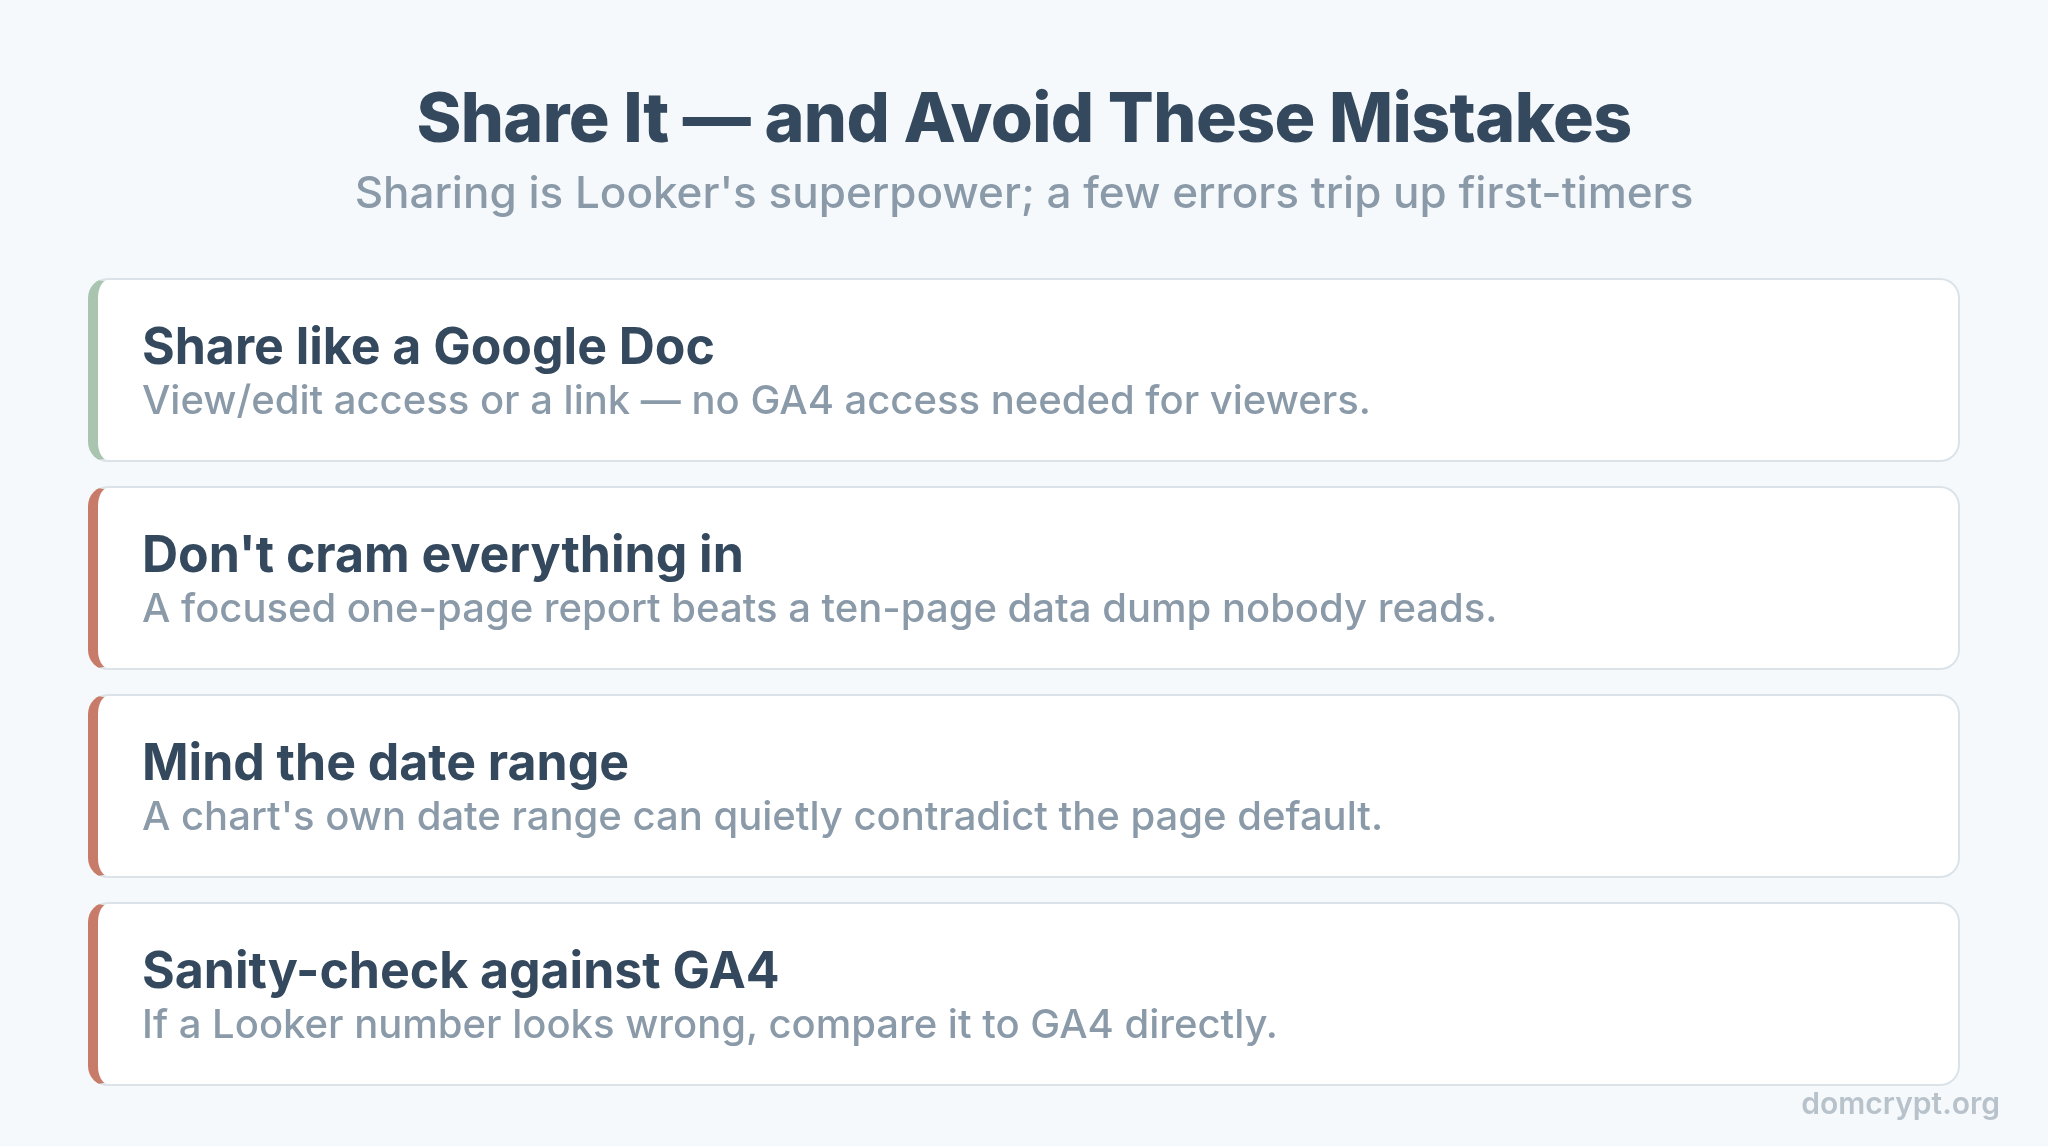
- Share like a Google Doc. Use the Share button to grant view or edit access, or generate a link — no GA4 access needed for viewers.
- Don’t cram everything in. A focused one-page report beats a ten-page data dump nobody reads.
- Mind the date range. A chart with its own date range can quietly contradict the page default. Keep them consistent.
- Sanity-check against GA4. If a Looker number looks wrong, compare it to GA4 directly — the same diagnostic care you’d take with bounce rate vs engagement rate.
The Bottom Line
Looker Studio is the bridge between GA4’s data and the people who need to see it. It’s free, it shares like a Google Doc, and it turns raw metrics into a report you’d be proud to send. Connect your GA4 property, assemble scorecards, charts, and controls into one focused page, add a date picker, and style it cleanly. Keep daily exploration in GA4 and let Looker handle the polished reporting — your first dashboard is genuinely an afternoon’s work, and it pays off every time someone asks “how are the numbers looking?”