Data Quality Audit: 15-Point Checklist Before Every Report
A data quality audit is the cheapest insurance an analyst buys. The most expensive mistake is not missing a number — it is reporting a confident number that is wrong. A dashboard headline like “+23% conversion” travels fast. If duplicated events, a broken filter, or a timezone mismatch produced that number, the cost compounds for weeks before anyone spots it. Run a data quality audit before every report, and the cost drops to a predictable fifteen minutes.
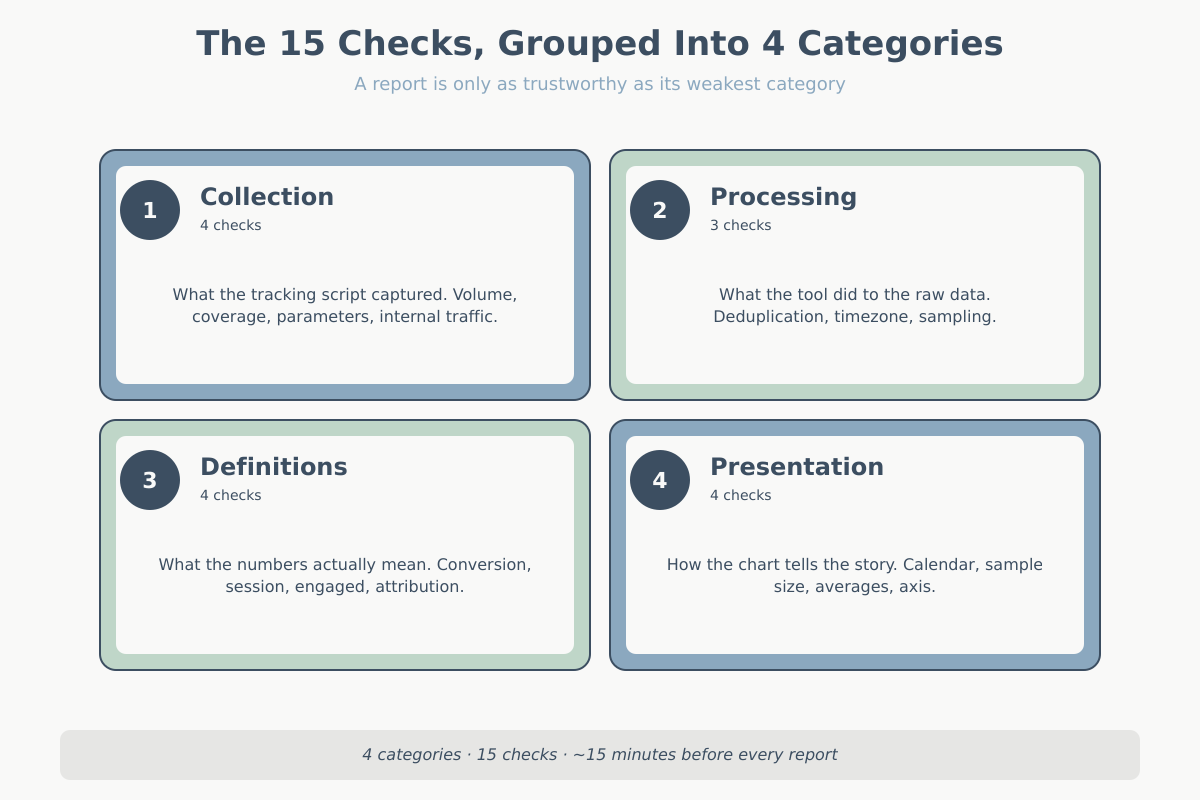
Before I send any report to a client, I run a short mechanical audit. Not a deep data review, not a full reconciliation with billing systems. Just a 15-point sanity pass that catches the failures I have actually seen in production over the past decade. This article is that checklist. It groups checks by category and stays tool-agnostic. The specifics will vary if you are in GA4, Matomo, Plausible, or a warehouse, but the questions do not.
Why a data quality audit saves your credibility
Stakeholders do not remember the forty reports you sent that were correct. They remember the one that was wrong, and specifically the moment they found out it was wrong. A stakeholder almost always catches it (before the next data quality audit), not you. They hold the business context you do not. The sales team knows last week had 42 orders, not 67. The CFO remembers the team paused the campaign budget on the 12th. The CMO remembers last year’s November had an extra Saturday.
A data quality audit is cheap insurance. Fifteen minutes of checks against a report that represents a quarter of strategic decisions is trivial. Skipping it is the single most common way analysts burn trust.
Category 1 — Collection checks in your data quality audit
Everything downstream depends on what the tracking script collected. If collection is broken, your cleaning logic and your modeling logic just polish the mistake. Always start here.
For a deep dive on the most common GA4 collection bugs, Simo Ahava’s GTM debug console guide is the external reference I come back to most.
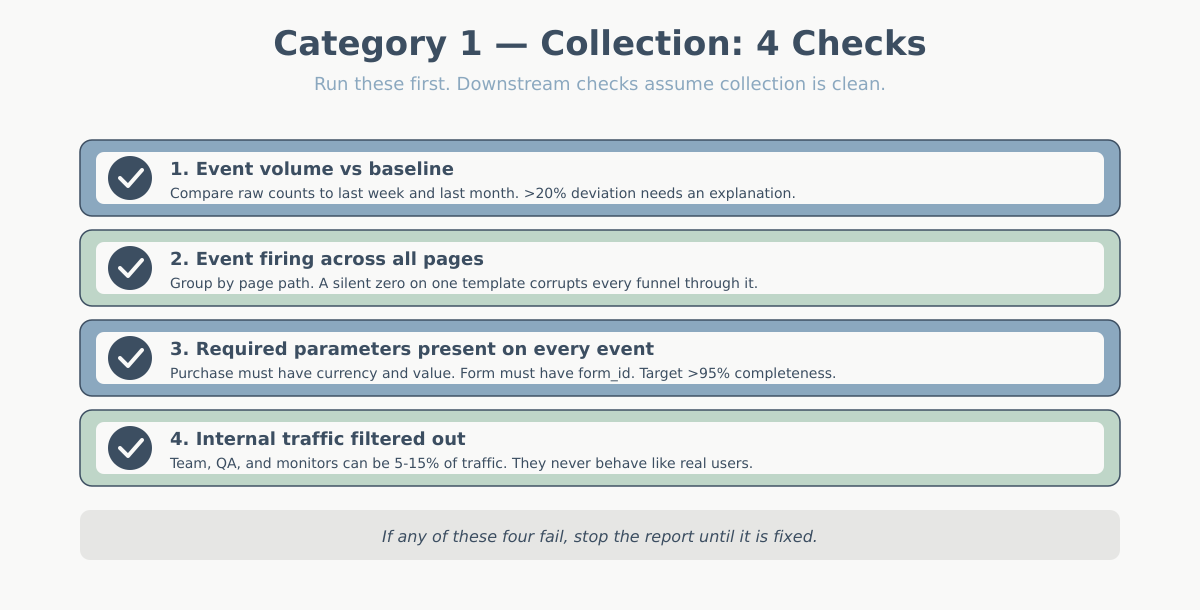
Data quality audit check 1 — event volume sanity against baseline
Compare the raw event count for the reporting period to the same period one week ago and one month ago. You are not looking for exact matches. You are looking for a deviation larger than anything you already know about. A 40% drop in page_view events on a Tuesday with no site change, no campaign change, and no tracking change is a red flag, not a trend. Most likely a tag stopped firing, a CMP blocked the script on a template, or someone republished the tag container without a critical trigger.
Keep a simple weekly baseline table for each key event: page_view, session_start, purchase, form_submit. Investigate anything off by more than 20% without explanation before you report.
Check 2 — Event firing across all pages (use a page-view sample)
It is not enough that the total event count looks normal. A site can lose tracking on an entire section — a new landing page, a checkout subdomain, a legacy help center — and the global numbers barely move. Pull a page-view sample grouped by page path or path template. Any path with meaningful traffic but zero or near-zero events downstream (no clicks, no scrolls, no form interactions) is suspicious.
This check catches the most damaging class of tracking failure: the silent one. A completely missing page drops to zero, which is loud. A page that fires page_view but nothing else looks fine in a traffic report and quietly corrupts every funnel.
Check 3 — Parameters present on every event
Events without their required parameters are almost useless. You cannot aggregate a purchase event into revenue if it lacks a currency or value parameter. You cannot attribute a form_submit to a specific form without a form_id. Run a parameter-completeness check: for each critical event, what percentage of occurrences has the required fields populated?
You are looking for numbers close to 100%. Anything under 95% on a required parameter demands an explanation before the data hits a report. Usually it is a legacy version of the site, an AMP variant, or a developer who added a new template without the full dataLayer push.
Check 4 — Filter out internal traffic before looking at anything
Internal traffic includes your own team, the client’s team, developers testing on staging that accidentally points at production, automated monitors, and QA tools. On small to medium sites it can easily be 5-15% of total traffic — and it behaves nothing like real users. They hit the same pages repeatedly, never convert, stay forever.
Confirm your internal IP filter or internal_traffic parameter is active on the report. If your team uses the site from home networks or mobile, IP filtering falls short. Add a URL marker or set a cookie on login. The point is to catch this before you produce a “bounce rate went up” narrative powered by the developer debugging a new release.
Category 2 — Processing
Once collection is clean, the tool processes the data: it deduplicates, buckets, stores, and queries. Processing bugs are subtler because the raw data looks fine; the problem is what the tool does to it before showing it to you.
Check 5 — Deduplication (duplicate events from SPA re-fires)
Single-page applications are the most common source of duplicate events. A technically single-page view can fire page_view twice. Once on initial load. Once after a client-side route change nobody expected to count as new. Purchase events duplicate when a user returns to the confirmation page — back button, refresh, or an analytics retry.
The signal is easy: look at sessions with an unusually high number of a typically-once event. A user with 8 purchase events in a session did not buy eight times. A user with 30 page_views in 90 seconds did not read 30 pages. Either deduplication logic is missing, or your SPA tracking is double-binding.
Check 6 — Timezone consistency
Three clocks can be out of sync: the site’s server time, the analytics property’s reporting timezone, and the customer’s local time. When your report says “Monday spike” and the customer says “that was Sunday evening for us,” you are looking at a timezone mismatch, not a pattern.
Before comparing time-of-day or day-of-week trends, confirm the reporting timezone of the analytics tool matches the business’s operating timezone. For international clients, be explicit in the report about which timezone the chart is in. A line that reads “All times in US/Eastern” at the bottom of a chart has saved me from thirty minutes of the wrong argument more than once.
Check 7 — Sampling warning
Sampled data aggregates a fraction of sessions and extrapolates the rest. It is not wrong in principle, but the confidence intervals are wider than the report suggests, and for small segments the sample can be unreliable. GA4 also applies thresholding. When segment sizes are too small, rows disappear entirely to protect user privacy. Your totals silently stop summing to the whole.
In Matomo and self-hosted tools, “sampling” often means stale archives — scheduled jobs did not run, so your report is reading a partial aggregate. Always check for the sampling indicator or thresholding notice. If you see it, either broaden the date range, remove the segment causing the sample, or explicitly note it in the report.
Category 3 — Metric definitions in a data quality audit
Definitional ambiguity ruins more reports than collection bugs. The number is technically correct. It just does not mean what the reader thinks it means. Always align definitions before you compare.
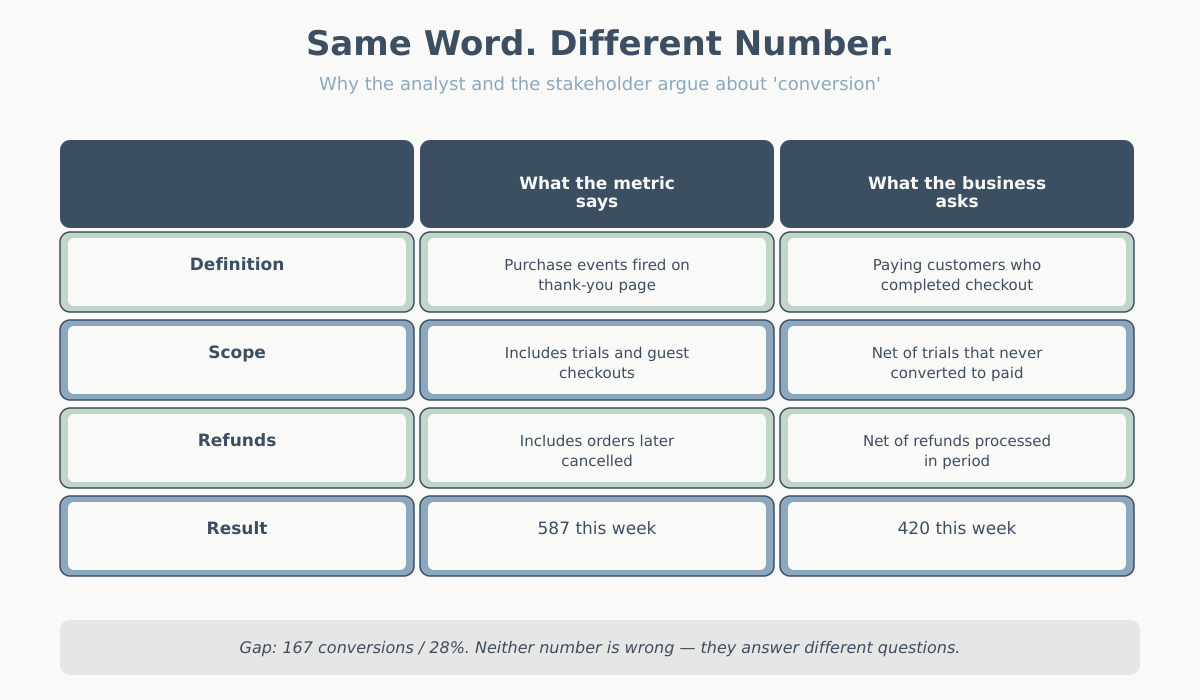
Check 8 — Does “conversion” match the business definition?
“Conversions” in most analytics tools is a count of a tracked event firing. The business definition is almost always narrower. Net of refunds. Excludes trials that users cancelled. Possibly excludes guest checkouts. Possibly excludes repeat buyers. Possibly excludes orders below a threshold. Say finance reports 420 paying customers for the week. Your dashboard says 587 conversions. That is not a discrepancy. It is two different metrics with the same label.
Before presenting a conversion number, write the working definition. One sentence: “A conversion here means a purchase event fired on the thank-you page, all order types, before refunds.” Then confirm the stakeholder is reading it as the same thing. This is also why I always link out to clear metric definitions when onboarding a new client.
Check 9 — Is “session” the same across tools?
A session in GA4 ends after 30 minutes of inactivity by default. In Matomo it is similar but configurable. Adobe calls the same thing a “visit” and defines it slightly differently. Marketers often think of a session as user-level — “the user’s visit to the site.” In reality, a session is an arbitrary 30-minute window. It can split a single purchase journey in half if the user took a long phone call.
When a chart shows sessions, make sure the reader knows what that means. If the business question is “how many people visited,” the answer is users, not sessions. If the question is “how many shopping trips did we get,” session is closer — but you should still say so explicitly.
Check 10 — Engaged vs total sessions
GA4 introduced engaged sessions: sessions that lasted over 10 seconds, had a conversion, or had 2+ page_views. It is the right default for most behavioral analysis because it excludes bounces. But it is not the same as total sessions. A YoY “+5%” can flip if you compare engaged sessions this year to total sessions last year.
Always label which version is in the chart. When migrating from Universal Analytics to GA4, never compare blindly. Engaged sessions in GA4 are typically 60-80% of total sessions in UA. That can look like a traffic collapse.
Check 11 — Attribution model consistency
Attribution models decide which marketing channel gets credit for a conversion. Last-click, first-click, linear, data-driven, position-based — each produces different numbers for the same conversions. Suppose last month’s report used data-driven attribution. This month defaults to last-click because someone changed a setting. You will deliver a “paid search is up 30%” story. The model switch produced the trend, not the traffic. Theitch.
Before comparing periods, confirm you are using the same attribution model as the prior report. If you are not sure which model applies, read the short primer on attribution models in web analytics and lock the choice into your reporting template.
Category 4 — Presentation
The last four checks are not about the data being wrong. They cover data presented in a way that leads to wrong conclusions. A technically correct number inside a misleading chart is worse than no data, because it comes with false authority.
Check 12 — Year-over-year comparisons normalized for calendar days and marketing cycles
April 2026 has five Tuesdays; April 2025 had four. Black Friday fell on the 28th in 2025 and the 27th in 2024. Easter moves around. If you compare “April 1-30 this year vs April 1-30 last year” without thinking about the structural differences, you will attribute a calendar effect to a marketing decision. At minimum, compare matched weekdays. Better: compare by marketing week or fiscal week so that cycle-aligned periods are side by side.
The same applies to campaigns. If a major sale ran on the 18th-22nd this year and the 22nd-26th last year, the week-over-week chart is nonsense. State the alignment method on the chart or do the heavy lifting of normalizing upstream.
Data quality audit check 13 — any metric on a weak sample size?
Rule of thumb: below 100 observations, a conversion rate is noise. Below 30, the number barely qualifies as an estimate. You will still see dashboards showing “conversion rate: 14.3%” for a segment with 7 sessions. That number should not be in the report. Either widen the date range, combine the segment with a similar one, or flag it explicitly as low-confidence.
The version of this I see most often: landing page comparisons where one page has 50 visits and another has 5,000. The 50-visit page wins on conversion rate 40% of the time by pure variance. The team spends a meeting asking “why is the new page converting better?” when the honest answer is “we have not seen enough traffic to say.”
Check 14 — Are you averaging averages?
This is the classic mistake and it still shows up in 2026. If Monday’s average order value was $40 and Tuesday’s was $60, the two-day average is not $50 unless both days had equal order counts. It is a weighted average. It depends on volume. Averaging the daily averages gives the wrong number — often badly wrong when one day is much busier than the other.
Always re-derive aggregates from totals: total revenue divided by total orders. Not the average of the daily AOVs. The same rule applies to bounce rate by segment, conversion rate by channel, and any other ratio metric aggregated over time or over groups.
Check 15 — Does the chart axis lie?
A bar chart with a y-axis starting at 82% instead of 0 makes a “83% to 85%” change look like a cliff. A line chart with a truncated y-range makes rounding noise look like a trend. A log-scale chart without a label makes exponential changes look linear. None of these are necessarily wrong to use, but all of them change the impression a reader takes away.
Default to a zero baseline unless there is a specific reason not to. If you truncate, say so on the chart. Never let default settings decide how readers interpret your data.
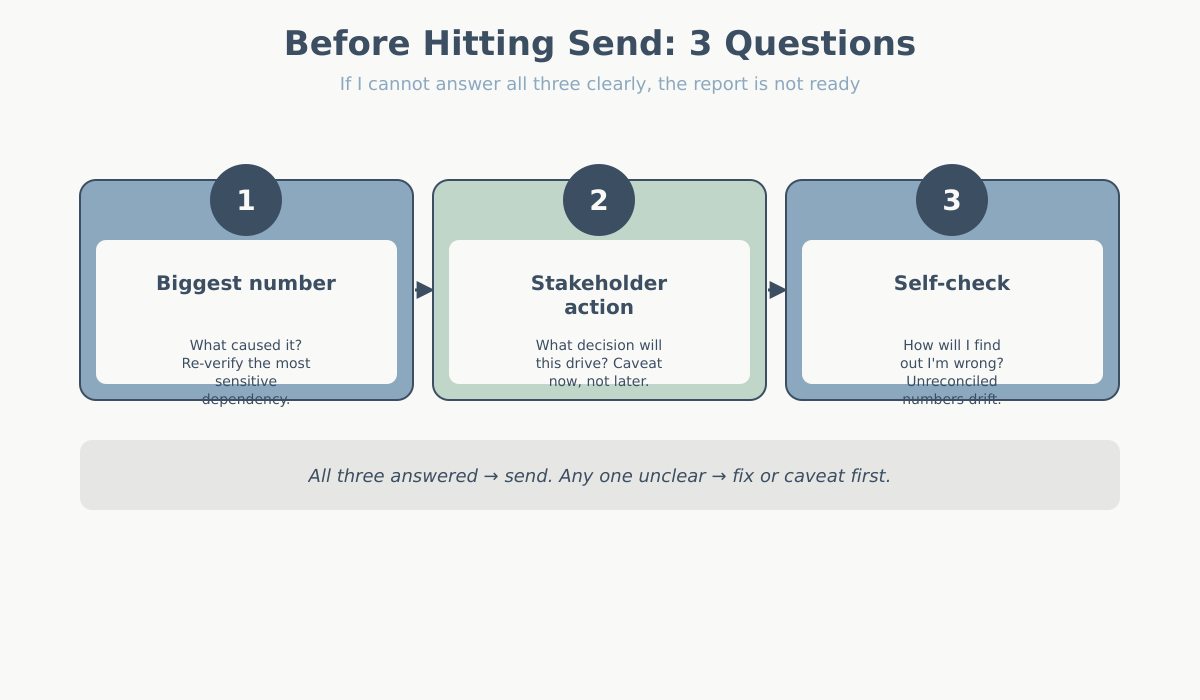
The data quality audit self-check: 3 questions before sending
After running the data quality audit checklist, I close the data and ask three questions out loud. If I cannot answer all three clearly, the report is not ready to send.
- If the biggest number on this report is wrong, what would have caused it? Forces me to identify the most sensitive dependency (is it a single event? a single filter? a single join?) and reconfirm it.
- What would the stakeholder most likely act on from this report, and am I confident enough for them to act on it? Flags any number that is too weak to support action. If I am not confident, I lower the emphasis or add a caveat.
- If I am wrong here, how will I find out? If the answer is “nobody will ever check,” the number should be treated with more suspicion, not less. Numbers that are never reconciled against ground truth drift the most.
When the data quality audit itself is the insight
Sometimes the audit itself produces the story. If you discover that 18% of purchase events are missing the product_id parameter, that is not just a data cleanup task — it is an insight. That means roughly 1 in 5 of your product-level sales reports rests on incomplete data. The same applies to a tracking pixel silently broken on mobile Safari for three months. Or a filter that excluded your single biggest campaign because of a typo.
When you find a genuine data quality issue affecting business metrics, lead the report with it. Do not bury it in an appendix. “Before we look at this month’s numbers, we found and fixed a tracking gap. It understated mobile purchases by ~12% going back to February.” That is the most valuable thing you can tell a stakeholder. It changes the baseline for every decision they made during that window.
The 15-point data quality audit summary
| # | Check | What fails if you skip it |
|---|---|---|
| 1 | Event volume sanity vs baseline | Tracking outages pass as trends |
| 2 | Event firing across all pages | An entire site section has zero data and nobody notices |
| 3 | Required parameters present on every event | Revenue, currency, or IDs missing on aggregated metrics |
| 4 | Internal traffic filtered out | Team/QA behavior distorts engagement metrics |
| 5 | Deduplicate duplicate events | Inflated page_views, orders counted twice |
| 6 | Timezone consistency | Day-of-week charts wrong, campaign windows shifted |
| 7 | Sampling or thresholding notice | Extrapolated numbers reported with false precision |
| 8 | Conversion matches business definition | Finance and analytics disagree on the same week |
| 9 | Session definition aligned with expectation | User count confused with visit count |
| 10 | Engaged vs total sessions labeled | Cross-version or cross-tool comparisons collapse |
| 11 | Attribution model consistent with prior report | Channel “growth” that is really a model switch |
| 12 | YoY normalized for calendar and cycles | Calendar artifacts reported as performance |
| 13 | No weak-sample-size metrics reported | Variance mistaken for signal, wrong decisions |
| 14 | Aggregates derived from totals, not averages of averages | AOV and rate metrics systematically wrong |
| 15 | Chart axis starts at zero or is labeled if not | Small changes read as dramatic shifts |
Conclusion
A data quality audit is not glamorous work. It does not produce a new insight or a pretty chart. It gives readers confidence that the insight and the chart hold up. Fifteen minutes before each report, every time. The analysts who get asked back to present again and again are not the ones with the best dashboards. They are the ones who have never had to send a correction email.