Why Your Conversion Rate Dropped: A Diagnostic Framework
A conversion rate drop is the Monday-morning email that tightens every founder’s chest. Yours is down 28% week-over-week, and the first instinct — from a CMO, a founder, or anyone watching the number — is to demand a fix by Friday. But a conversion rate drop isn’t a problem. It’s a symptom. And the worst thing you can do is start “fixing” before you’ve diagnosed the conversion rate drop.
I’ve watched teams rebuild a checkout page over a phantom drop caused by a broken GTM trigger. I’ve seen agencies get fired for a CVR slump that was, in hindsight, a competitor’s Super Bowl ad pulling away undecided traffic. Diagnosis first. The framework below is how I work through a sudden conversion rate drop — in order, with numbers, without panic.
Step 1 — Is the conversion rate drop real?
Most “drops” that land in someone’s inbox aren’t statistically meaningful. Conversion rate is a ratio of two noisy numbers, and both wobble day to day. Before you investigate anything, ask whether the variation exceeds normal fluctuation.
Two quick sanity checks. First, compare against the same weekday in the prior 4-6 weeks, not just yesterday. Tuesday vs. Monday comparisons are worthless for most B2C and almost all B2B sites. Second, look at raw absolute conversions, not just the percentage. If your baseline CVR is 2.1% on 5,000 sessions (105 conversions) and today you’re at 1.7% on 5,200 sessions (88 conversions), that’s a real shift in volume, not a ratio artifact.
The rough rule I use: for a daily conversion count under 100, expect ±15-20% daily swings as noise. Under 50 daily conversions, even ±30% swings can be random. Don’t diagnose a conversion rate drop that doesn’t exist.
The confidence interval shortcut
If you want a quick statistical check without pulling out a calculator, here’s a mental shortcut. Compute the standard error of your conversion rate as sqrt(p × (1-p) / n), where p is your CVR and n is session count. Multiply by 2 to approximate a 95% confidence interval. If the new rate falls inside that band, it’s noise.
Example: baseline 2.5% on 8,000 sessions. SE = sqrt(0.025 × 0.975 / 8000) ≈ 0.0017 or 0.17%. The 95% band is 2.5% ± 0.34%, so 2.16% to 2.84%. A reading of 2.3% is noise. A reading of 1.8% is real.
One more check: look at week-over-week and year-over-year together. A site with strong seasonality (think ecommerce, travel, education) can drop 20% WoW and still be up 15% YoY. Context matters.
A practical habit: before you call anything a “drop,” pull at least 6 weeks of daily CVR data and eyeball the variance. If you see the current reading sitting inside the historical band — even if it’s at the low end — you’re almost certainly looking at noise. I’ve saved myself dozens of hours by waiting 72 extra hours on a “drop” that turned out to be two mediocre days in a row, which is not the same thing as a trend.
Step 2 — Check the tracking layer first
If the drop is real, the very next question is: are we measuring correctly? Tracking failures cause the most misleading “CVR drops” I see in the wild. A deploy last Thursday, a GTM container update, a cookie banner change, a new CMP — any of these can silently break conversion tracking and make a perfectly healthy funnel look catastrophic.
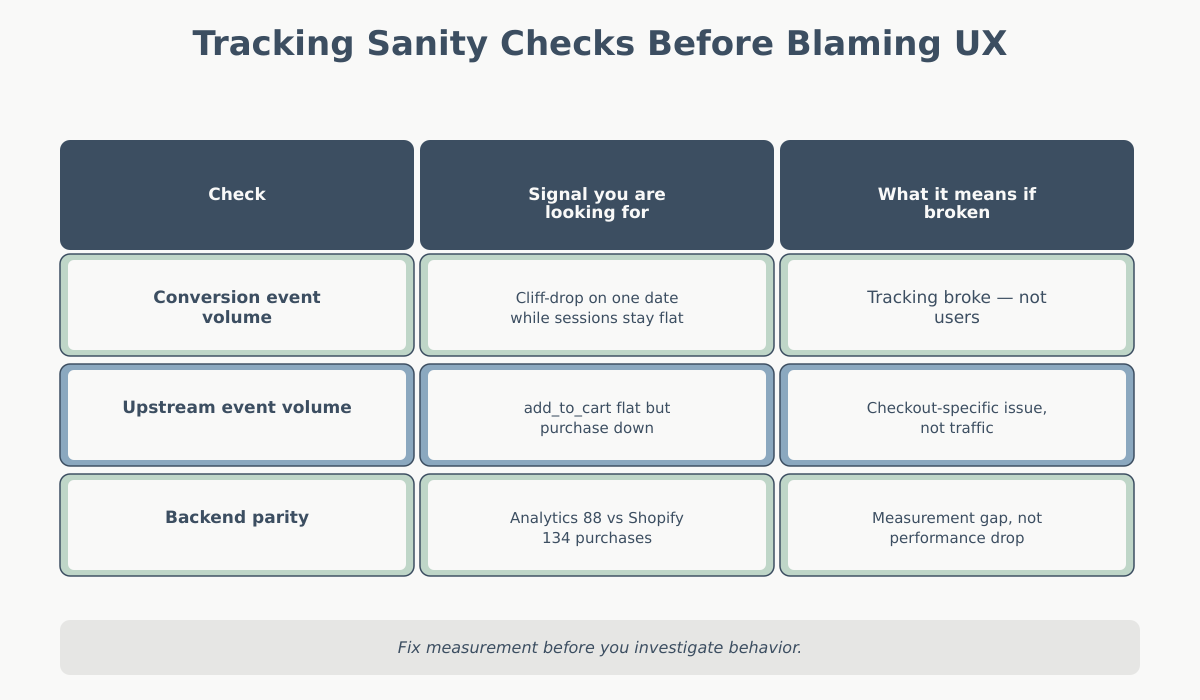
Three things to verify before touching any hypothesis about user behavior:
- Conversion event volume. Pull the raw count of your conversion event (purchase, form_submit, signup) by day. If it dropped off a cliff on one specific date while sessions held steady, you have a tracking issue, not a user issue.
- Upstream event volume. If purchases are down 40% but add_to_cart is also down 40%, the problem is earlier. If purchases are down 40% but add_to_cart is flat, you’re either losing people at checkout — or losing the checkout tracking.
- Event parameter integrity. For GA4, check that transaction_id, value, and currency are still present. A missing currency parameter won’t stop the event from firing but can exclude it from revenue reports, which distorts “converting sessions” downstream.
The quick test I run: compare the conversion count in analytics against the backend source of truth — Shopify orders, Stripe charges, CRM leads. If analytics says 88 conversions and the backend says 134, you have a measurement gap, not a performance problem. Fix measurement before anything else.
A concrete checklist I walk through on the tracking layer before moving on:
- Did anyone deploy code, GTM, or CMS changes in the 48 hours before the drop started? Check deployment logs and GTM version history.
- Did the consent banner, cookie policy, or CMP change? Consent opt-in rate changes directly reduce measured conversions without changing actual conversions.
- Are there any new JavaScript errors on conversion pages? A single unhandled error on the thank-you page can block pageview firing.
- Is the GA4 DebugView still receiving events when you browse through the flow in debug mode?
- Did any third-party script (chat widget, exit-intent popup, personalization tool) ship an update? These often inject DOM changes that break custom event selectors.
I’ve seen all five of these cause real “CVR drops” that had nothing to do with users. The most embarrassing one: a team rewrote their exit-intent popup library, which suppressed clicks on the underlying “Buy Now” button for two seconds after page load. Mobile users were tapping into empty space. Desktop users noticed less because mouse hover triggered the popup differently. It took three days to find because nobody connected the popup deploy to the CVR drop.
For a deeper view of how engagement metrics can mislead you here, see bounce rate vs. engagement rate in GA4 — engagement rate changes often accompany tracking regressions and are worth checking side-by-side.
Step 3 — Isolate where the conversion rate drop is coming from
Tracking is clean, the drop is real. Now you segment. A CVR drop is almost never uniform across the traffic mix — and finding where it concentrates is usually where the answer lives.
I go through four dimensions in this order, because each eliminates the most hypotheses fastest:
Channel mix
Break CVR down by default channel grouping. The question isn’t “which channel converts worst” — it’s “which channel’s CVR changed.” A channel whose CVR is stable but whose volume spiked can tank aggregate CVR through mix alone. This is the single most common cause of “fake” drops: a cheap paid social campaign drove 40% more sessions at a 0.4% CVR and pulled the whole average down. Nothing is broken. The mix changed.
Useful quick math: compute a channel-weighted CVR using last period’s volume shares. If that number matches last period’s CVR, the change is pure mix. If it’s still down, at least one channel actually regressed.
Device
Mobile, desktop, tablet. A drop concentrated on mobile usually points to a technical change — iOS Safari update, a new cookie banner that’s unusable on small screens, a hero image that pushed the CTA below the fold on 375px widths. I’ve seen a new “request a demo” modal drop mobile CVR 60% while desktop held steady, because the modal close button rendered behind the keyboard on iOS.
Landing page
Group sessions by landing page and compare CVR period-over-period. If one or two pages drive the drop, you likely have a page-specific issue: a broken form, a removed CTA, a page that was redirected, a new A/B test variant that’s underperforming. If the drop is spread across all landing pages equally, the cause is global — site-wide, audience-wide, or temporal.
Geography
Usually a lower-priority cut, but worth a glance. Drops concentrated in a single country can point to payment processing issues, shipping changes, regulatory effects (GDPR consent banner rollout in the EU), or local competitor activity. Drops that affect only non-primary markets are often noise.
For a reminder of which metrics pair well with CVR in this segmentation step, the overview of key website metrics is a useful reference.
Step 4 — Audit the funnel
Tip: For e-commerce funnels specifically, Baymard’s cart abandonment research gives you an external sanity check on expected checkout drop-off rates.
By now you know the drop is real, your tracking is clean, and you’ve narrowed it to one or two segments. The next job is to find where in the journey users are falling off.
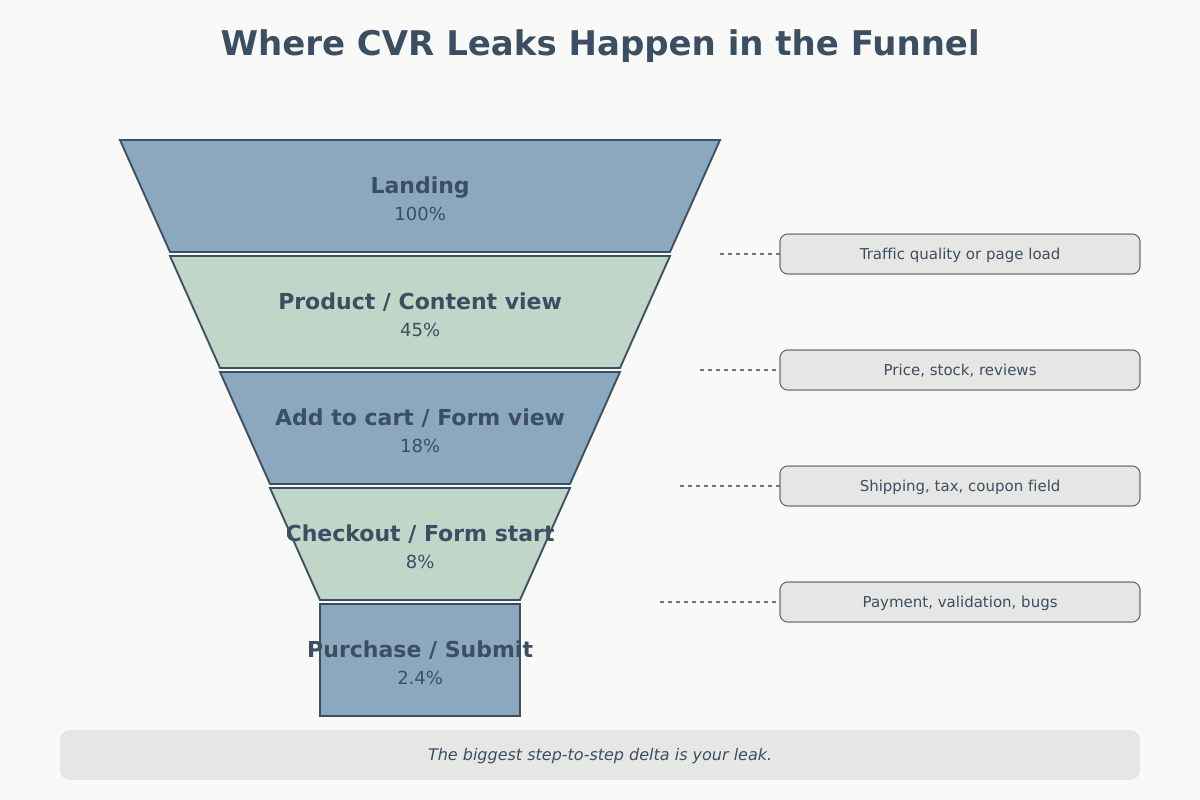
Define your funnel in concrete steps. For an ecommerce site, something like: landing → product_view → add_to_cart → begin_checkout → purchase. For SaaS: landing → pricing_view → signup_start → signup_complete → activation. For lead gen: landing → content_view → form_view → form_submit.
Compute the step-to-step conversion rate for each stage, both before and after the drop. One step will have regressed noticeably more than the others. That’s your leak.
Here’s what I typically see:
| Leak location | Likely cause |
|---|---|
| Landing → first action | Traffic quality shift, page load regression, copy change |
| Product view → add to cart | Price change, stock issues, review badges removed |
| Cart → checkout start | Shipping cost surprise, new tax calculation, coupon field broken |
| Checkout start → purchase | Payment method removed, address validation error, field validation bug |
| Form view → form submit | New required field, CAPTCHA change, form field validation regression |
A useful diagnostic: if the leak is at the very first step (landing → first action), the problem is almost always traffic quality or landing page change. If the leak is at the very last step, the problem is almost always technical (payment, validation, checkout bug). The middle steps are where UX and merchandising issues hide.
One caveat: step-to-step rates are sensitive to tracking. If your add_to_cart event started misfiring on mobile Safari, you’ll see a “leak” at product_view → add_to_cart that isn’t real. Loop back to Step 2 if anything looks suspicious.
Step 5 — External factors behind a conversion rate drop
Tracking is fine. Segments are isolated. The funnel leak is identified. But sometimes the root cause sits outside your site entirely, and pretending otherwise wastes a week. Before you write up a recommendation, rule out external factors.
Seasonality
Compare against the same week last year, not just last month. Back-to-school, tax season, holiday troughs, industry-specific cycles (B2B deals stall in late December, ecommerce spikes before Black Friday and crashes after). If your YoY CVR is flat but WoW is down, you’re probably looking at seasonality.
Campaign changes
Did a high-intent campaign end? Did budget shift to a top-of-funnel channel? Did a brand campaign launch that’s pushing in curious-but-not-ready traffic? A 20% drop in CVR right after expanding paid search to broader keywords is not a site problem — it’s an audience problem. This is where attribution models matter: a last-click view can hide the fact that awareness campaigns are feeding the funnel for branded-search conversions you’re now under-counting.
External events
News cycles, competitor launches, platform outages. I once spent three days diagnosing a B2B SaaS CVR drop before realizing a major competitor had launched a free tier the previous Monday. Our trial signups were cannibalized; our CVR recovered partially after we adjusted positioning. A 10-minute check of competitor announcements and industry news would have saved 20 hours of funnel analysis.
Platform or policy changes
iOS privacy updates, new ITP rules, Chrome third-party cookie changes, CMP vendor updates, consent mode v2 rollouts. Any of these can shift measured CVR without changing underlying user behavior. Check your release notes, your consent rates, and your vendor status pages.
Putting it together — the conversion rate drop decision tree
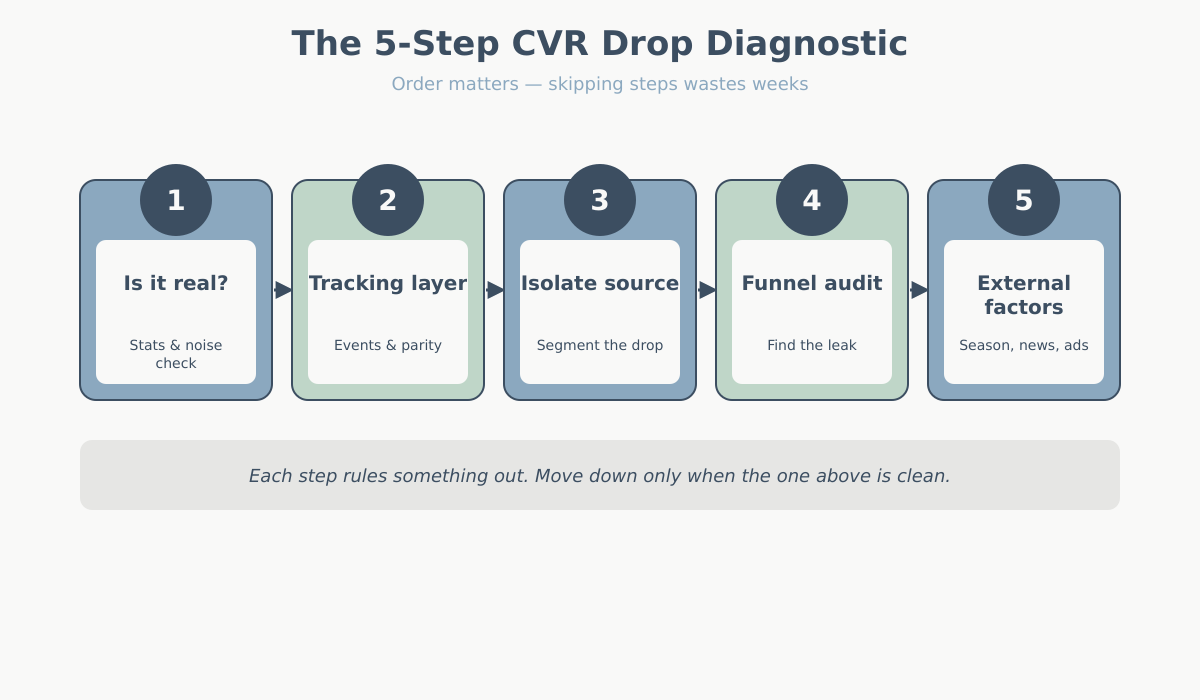
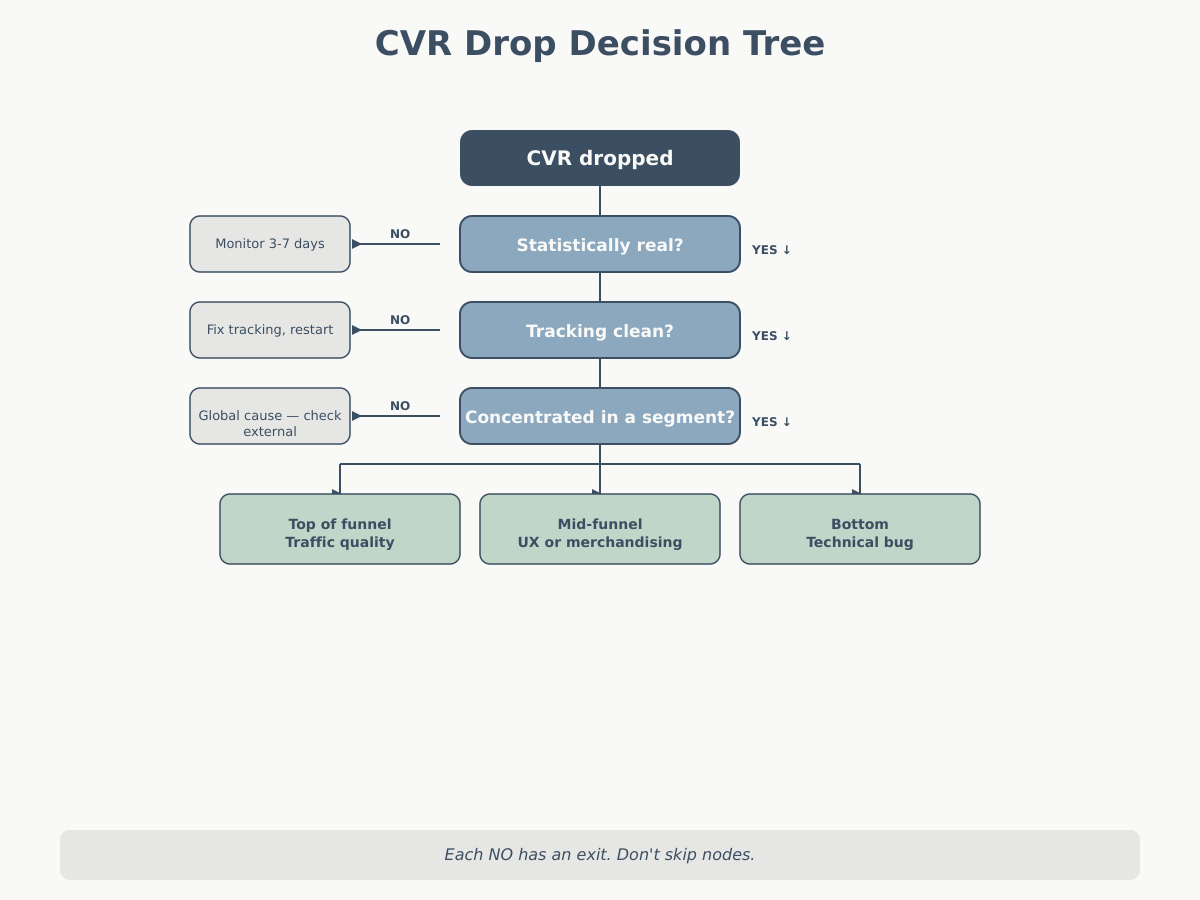
The flow I actually follow, in order, with a clear exit at each node:
- Is the drop statistically meaningful? Check weekday comparisons, YoY, absolute counts, and confidence interval. If no → stop, it’s noise, monitor for another 3-7 days.
- Is tracking clean? Verify conversion event volume, upstream event volume, and reconcile against backend source of truth. If no → fix tracking first, re-measure, restart from Step 1.
- Does the drop concentrate in a segment? Cut by channel, device, landing page, geography. If yes → anchor all further investigation to that segment.
- Where does the funnel break? Compute step-to-step CVR before and after. The stage with the largest delta is the leak.
- Can external factors explain it? Seasonality, campaign changes, competitor launches, platform updates. If yes → document and monitor. If no → investigate the leak as a site issue.
The order matters. If you skip Step 2 and spend a week redesigning a checkout page, you’ll feel smart when CVR “recovers” — but it was a GTM fix that did it, not your redesign. If you skip Step 5 and assume every drop is your fault, you’ll optimize away perfectly healthy traffic by narrowing your audience.
Common mistakes analysts make when diagnosing a conversion rate drop
After years of watching teams run this investigation, I see the same missteps repeatedly. None of these are stupid — they’re just seductive shortcuts that lead the wrong direction.
1. Starting with a hypothesis instead of the conversion rate drop data
“The new checkout design must be the problem.” Maybe. But if you start by checking the new checkout and find nothing, you’ve wasted four hours and confirmed nothing. Start with the segmentation cut. Let the data tell you which hypothesis to investigate.
2. Ignoring mix shifts
A 15% drop in aggregate CVR can come from zero channels actually regressing, if the channel mix shifted. Before you blame the site, compute the mix-adjusted CVR. This is especially important during active media changes — campaign launches, seasonal paid pushes, or changes in organic traffic composition.
3. Over-weighting recency when reading a conversion rate drop
Humans see a two-day trend as a new normal. Two days is noise. Five days is a signal worth investigating. Two weeks is something to act on. Don’t push a fix live based on 48 hours of data; you’ll ship the wrong solution.
4. Confusing lagged conversions with drops
If your product has a 7-day consideration window, today’s CVR reflects sessions that largely happened 3-7 days ago. A drop today might be a real drop that started a week ago, or a drop in today’s sessions that won’t manifest as a CVR issue for another week. Look at cohort conversion curves, not just daily rollups. This matters more for higher-consideration products — SaaS trials, B2B leads, expensive ecommerce — and less for impulse purchases.
A related trap: attribution models with long lookback windows. A 30-day last-click view mixes today’s sessions with conversions from month-old sessions. If your traffic composition shifted three weeks ago, you’re seeing the echo today. Switch to a session-based CVR view (sessions and conversions in the same window) when diagnosing drops, and keep attributed CVR for commercial reporting only.
5. Fixing symptoms of a conversion rate drop instead of diagnosing root cause
“CVR is down, so let’s run a 10% off promo.” This temporarily masks the problem and teaches your audience to wait for discounts. If the root cause is a broken form or a tracking bug, a promo doesn’t fix it — it just buys a week of cover while the real issue continues. Diagnose first, then treat.
Action items
When you get the message that conversion rate dropped:
- Don’t promise a fix. Promise a diagnosis within 48 hours.
- Run the 5-step check in order. Don’t skip tracking verification — it’s the cheapest and most common root cause.
- Segment before you hypothesize. Let the data narrow the problem space.
- Reconcile analytics against a source of truth (orders, CRM, payments) before you trust the number.
- Document what you ruled out, not just what you found. That’s how you build a diagnostic playbook that works next time.
A CVR drop is a starting point, not a conclusion. The analysts who get this right aren’t the fastest to act — they’re the slowest to assume.